
A portfolio can grow on paper while the money inside it buys less. That is why the return worth understanding is the return measured against the cost of the life, commitments and opportunities that capital is supposed to support.
A headline percentage is a starting point. It tells us very little until we know the period, the currency, the costs and the change in purchasing power. An 8% gain can be attractive in one setting and disappointing in another. The difference is not a matter of presentation; it is a matter of arithmetic.
I prefer to approach this question in layers: first identify the investment's total return, then account for the costs that actually apply, translate it into the relevant currency, and finally test what remains against inflation. The purpose is to make comparisons clearer, rather than to turn one percentage into a universal rule.
1. Nominal growth and real progress are different measurements
Nominal return describes a change in the amount of money. Real return describes that change after adjusting for prices. The European Central Bank explains this distinction through the purchasing power of savings: receiving more money does not necessarily allow a saver to buy more goods and services.
Concept reference: ECB — nominal and real interest rates.
Consider a simple one-year example. An investment starts at $10,000 and ends at $10,800, with no deposits or withdrawals. The nominal return is 8%. If the relevant price level has risen by 5% over that same year, the ending balance must be divided by 1.05 to express it in starting-year purchasing power. It is then worth approximately $10,285.71, a real gain of 2.86%.
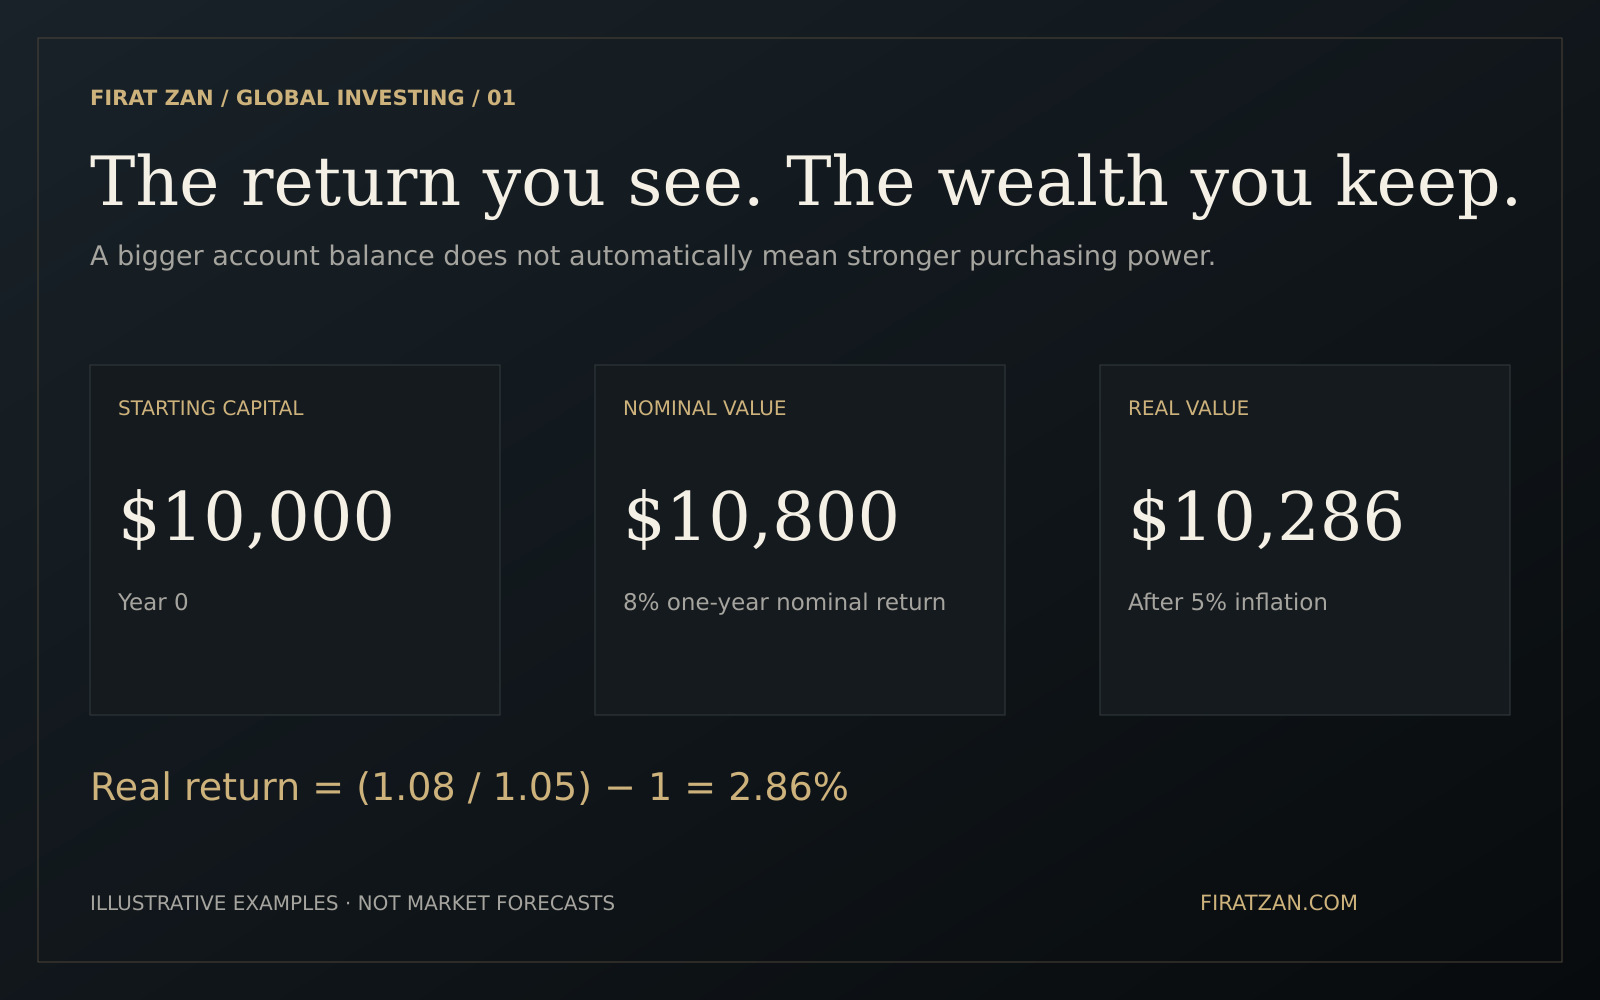
The denominator matters because the prices of the things you buy have changed as well as the balance in your account. With 8% nominal growth and 5% inflation, the rough subtraction gives 3%, while the exact calculation gives 2.86%. When inflation is larger, the gap between those two methods can become more noticeable.
2. The inflation assumption changes the conclusion
Suppose the nominal return is 10%. With 2% inflation, the real return is approximately 7.84%. With 5% inflation, it is 4.76%. With 10% inflation, purchasing power is unchanged. With 15% inflation, the real return is approximately −4.35%. The investment balance rises in all four examples, but its economic meaning changes.
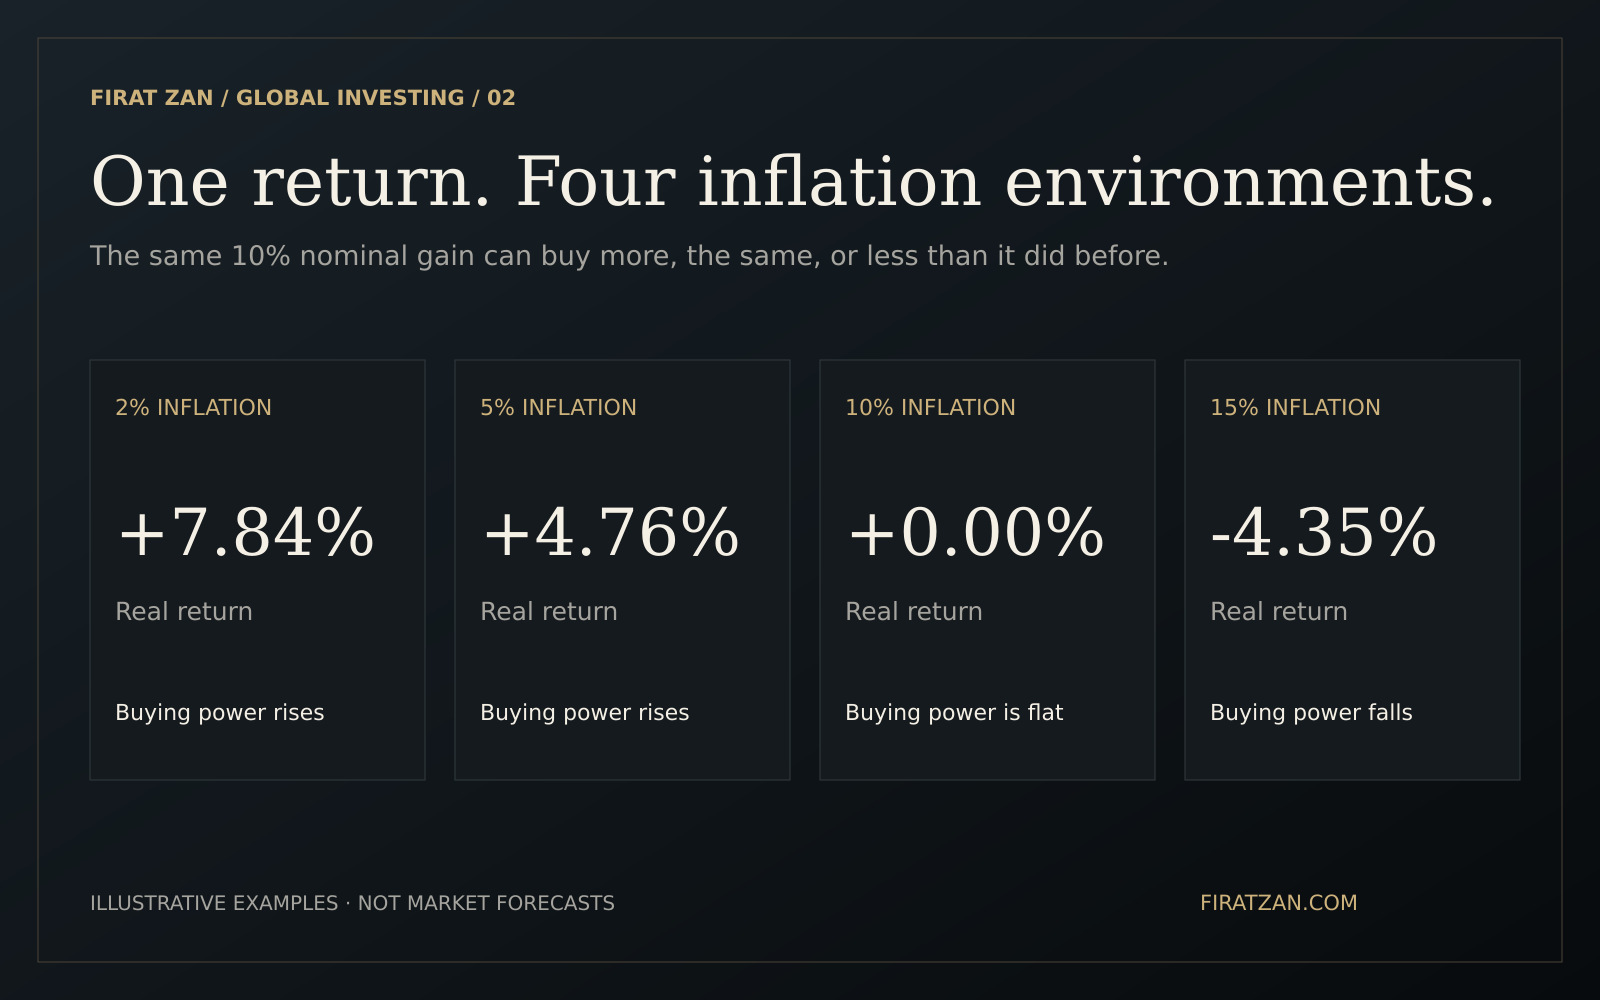
These are deliberately hypothetical scenarios. They are not current inflation figures for any country, and they are not forecasts. Their purpose is to show why a nominal percentage cannot be judged independently of the environment in which the proceeds will be used.
The inflation measure should fit the question. A broad consumer-price index is useful for a general purchasing-power calculation. A specific goal may require another comparison: a future property purchase, education expenses or a budget split across countries may not move at the same rate as an average consumer basket. Keep the official measure and the goal-specific estimate distinct, and state which one you are using.
The dates must match too. Comparing an investment's return over one calendar year with inflation over a different twelve-month window creates a misleading result. Keep the start and end dates consistent before interpreting the numbers.
3. A global investor has to translate the return
An overseas asset can perform well in its local currency and produce a different result in the currency used for reporting or spending. Investor.gov identifies exchange-rate movements as one of the risks that can increase or reduce the return from international investments.
Concept reference: Investor.gov — international investing.
For a one-period investment without intervening cash flows, the relationship is: reporting-currency return = (1 + local asset return) × (1 + currency return) − 1. Here, currency return means the change in the value of one unit of the asset's currency, measured in the reporting currency. Defining the exchange-rate direction avoids accidentally reversing the effect.
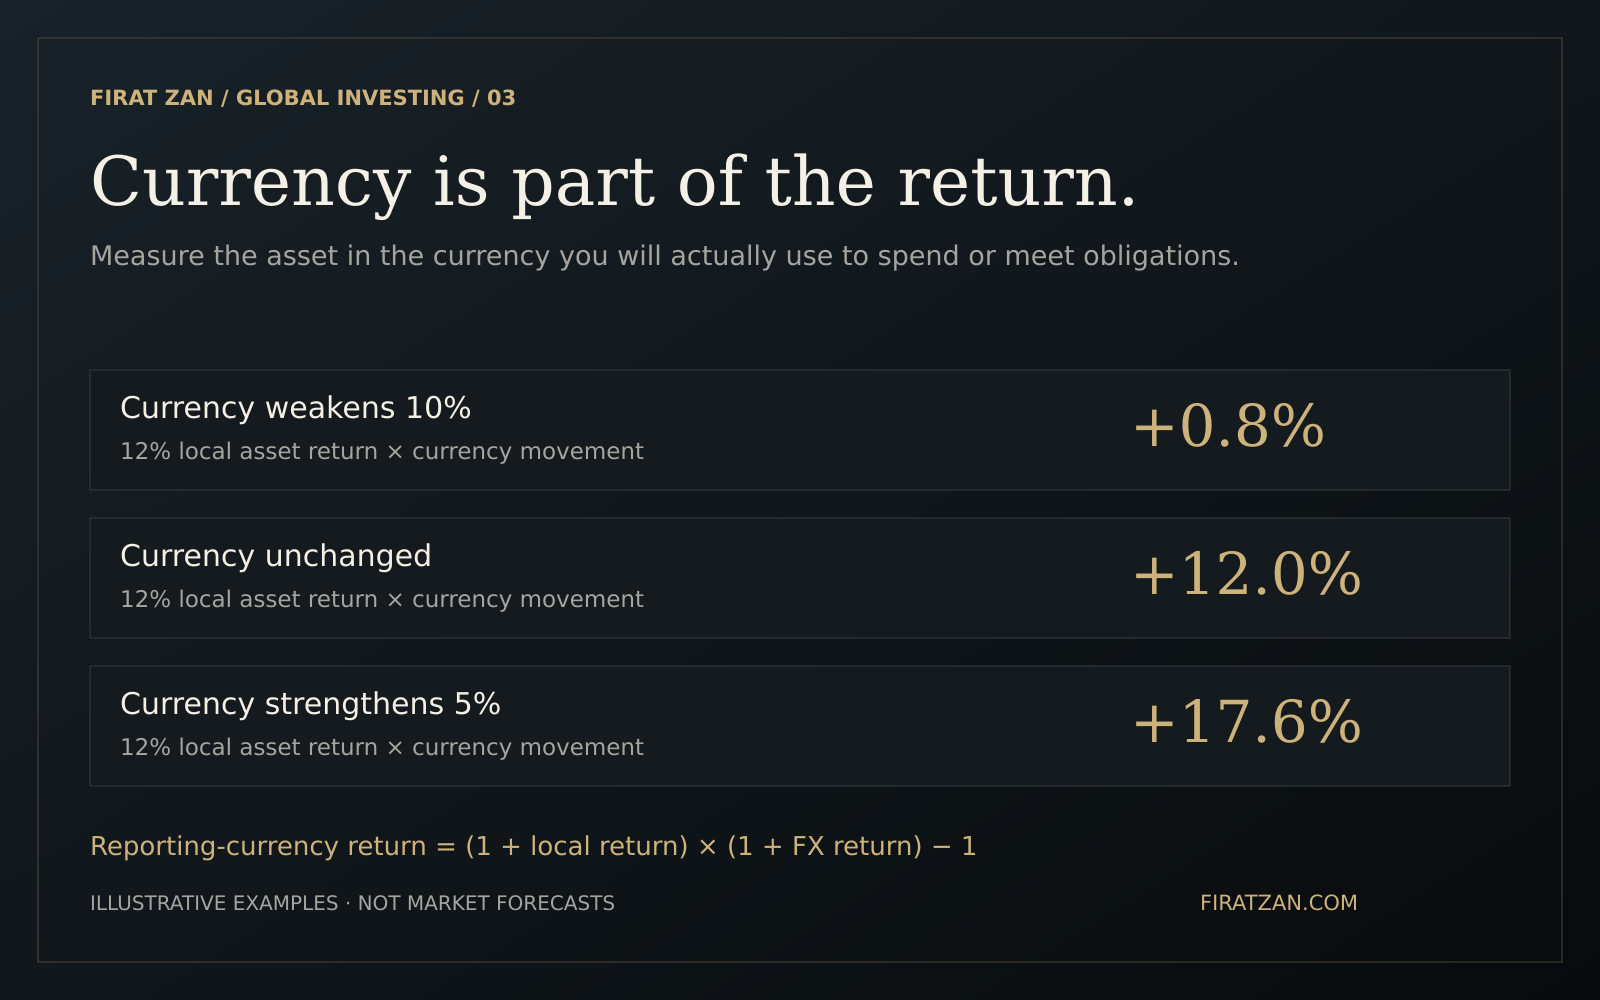
If the asset gains 12% locally while its currency loses 10% against the reporting currency, the translated return is 0.8%: 1.12 × 0.90 − 1. If that currency instead strengthens by 5%, the translated return becomes 17.6%. Neither result is obtained by simply adding the two percentages.
Inflation comes after that translation when the question is purchasing power in the reporting currency. In the first scenario, a 0.8% translated gain with 3% inflation in the spending environment produces a real result of approximately −2.14%. Do not subtract local inflation and reporting-currency inflation from the same return as though they were independent fees.
An account displayed in dollars is not necessarily an investment with no currency exposure. The assets underneath it, their revenues and any hedges can introduce other exposures. For a practical comparison, identify both the reporting currency and the obligations the capital is expected to fund.
4. Fees and taxes belong in the calculation
The SEC's investor education bulletin explains that investment fees reduce returns and the capital available to earn future returns. Charges can arise when buying and selling, or continue while an investment is held. Understanding which costs are already embedded in reported performance helps avoid counting them twice.
Concept reference: Investor.gov — how fees and expenses affect a portfolio.
Here is an explicit illustration, rather than a claim about a particular product or tax regime. Start with $10,000, earn an 8% gross return, and charge a 1% fee against the entire $10,800 ending value. The fee is $108, leaving $10,692. Assume a hypothetical 20% tax on the remaining $692 gain: that costs $138.40 and leaves $10,553.60.
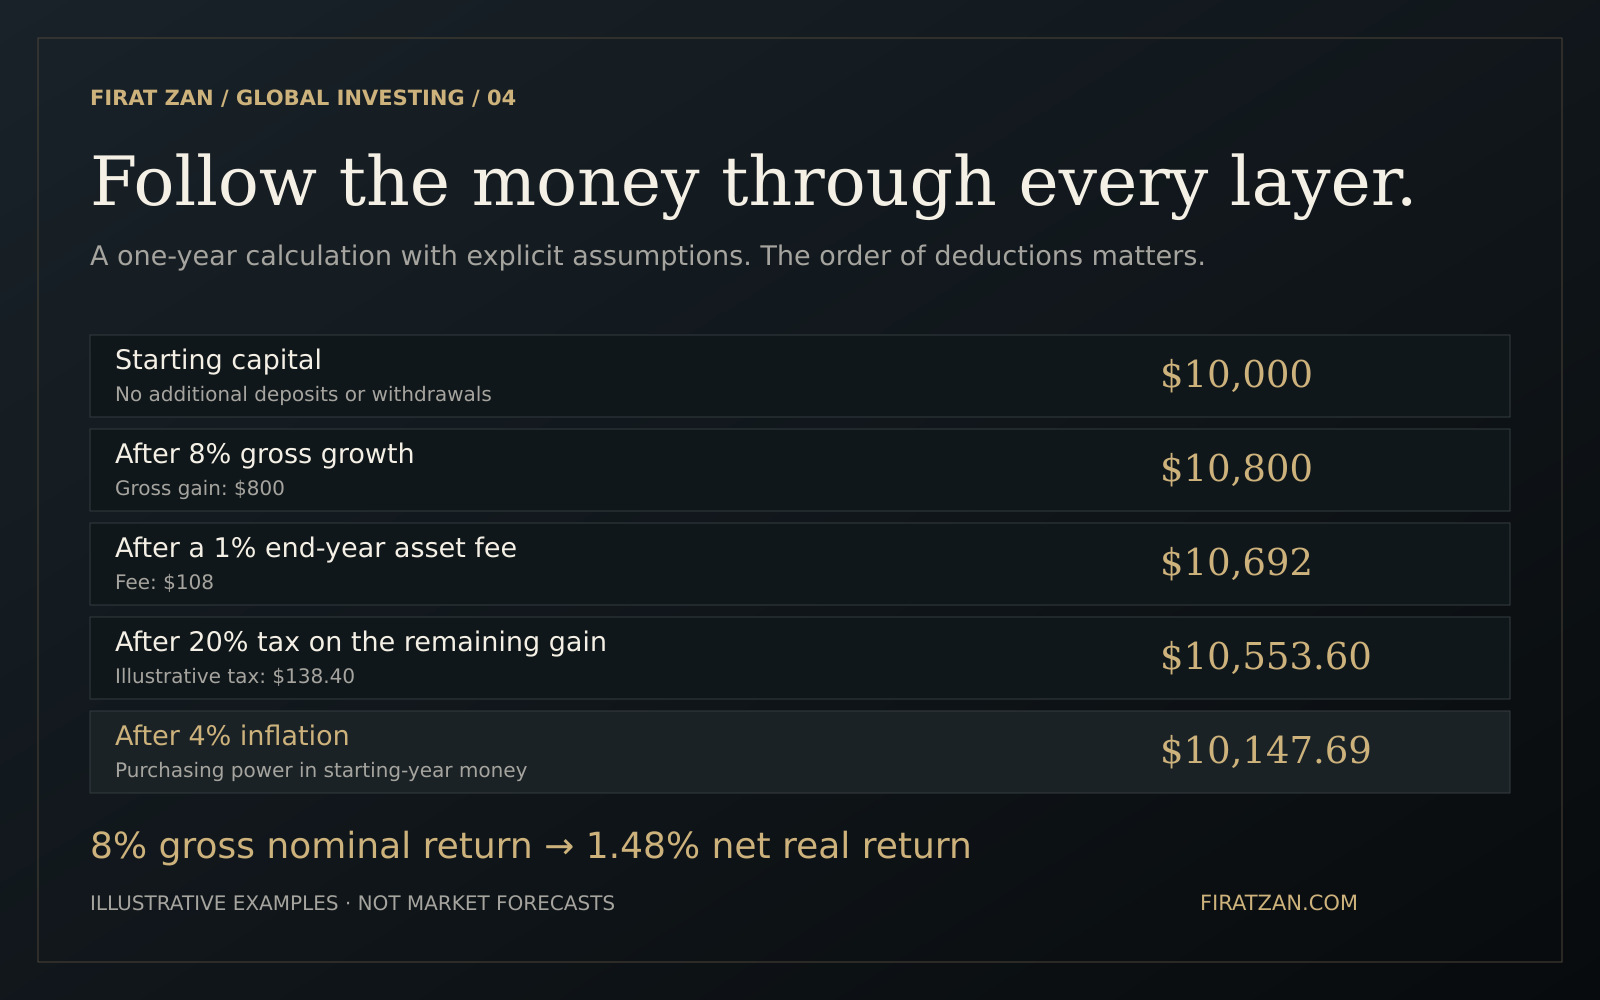
With 4% inflation over the same period, that final balance has starting-year purchasing power of approximately $10,147.69. The gross nominal return was 8%, the net nominal return is 5.536%, and the net real return is approximately 1.48%. The graphic's fee timing and tax base are assumptions, not a universal sequence for every investment.
Actual tax outcomes depend on the investment, jurisdiction, investor circumstances, account structure and timing. Actual fees can use different bases and payment schedules. Replace the illustration's assumptions with the applicable terms before using this framework for a real comparison.
5. Compounding needs a purchasing-power view
Over several years, price growth compounds alongside investment growth. The calculation should compare the accumulated investment growth factor with the accumulated price growth factor. If returns or inflation change each year, use the sequence of actual annual factors rather than an arithmetic average as though it were a compounded rate.
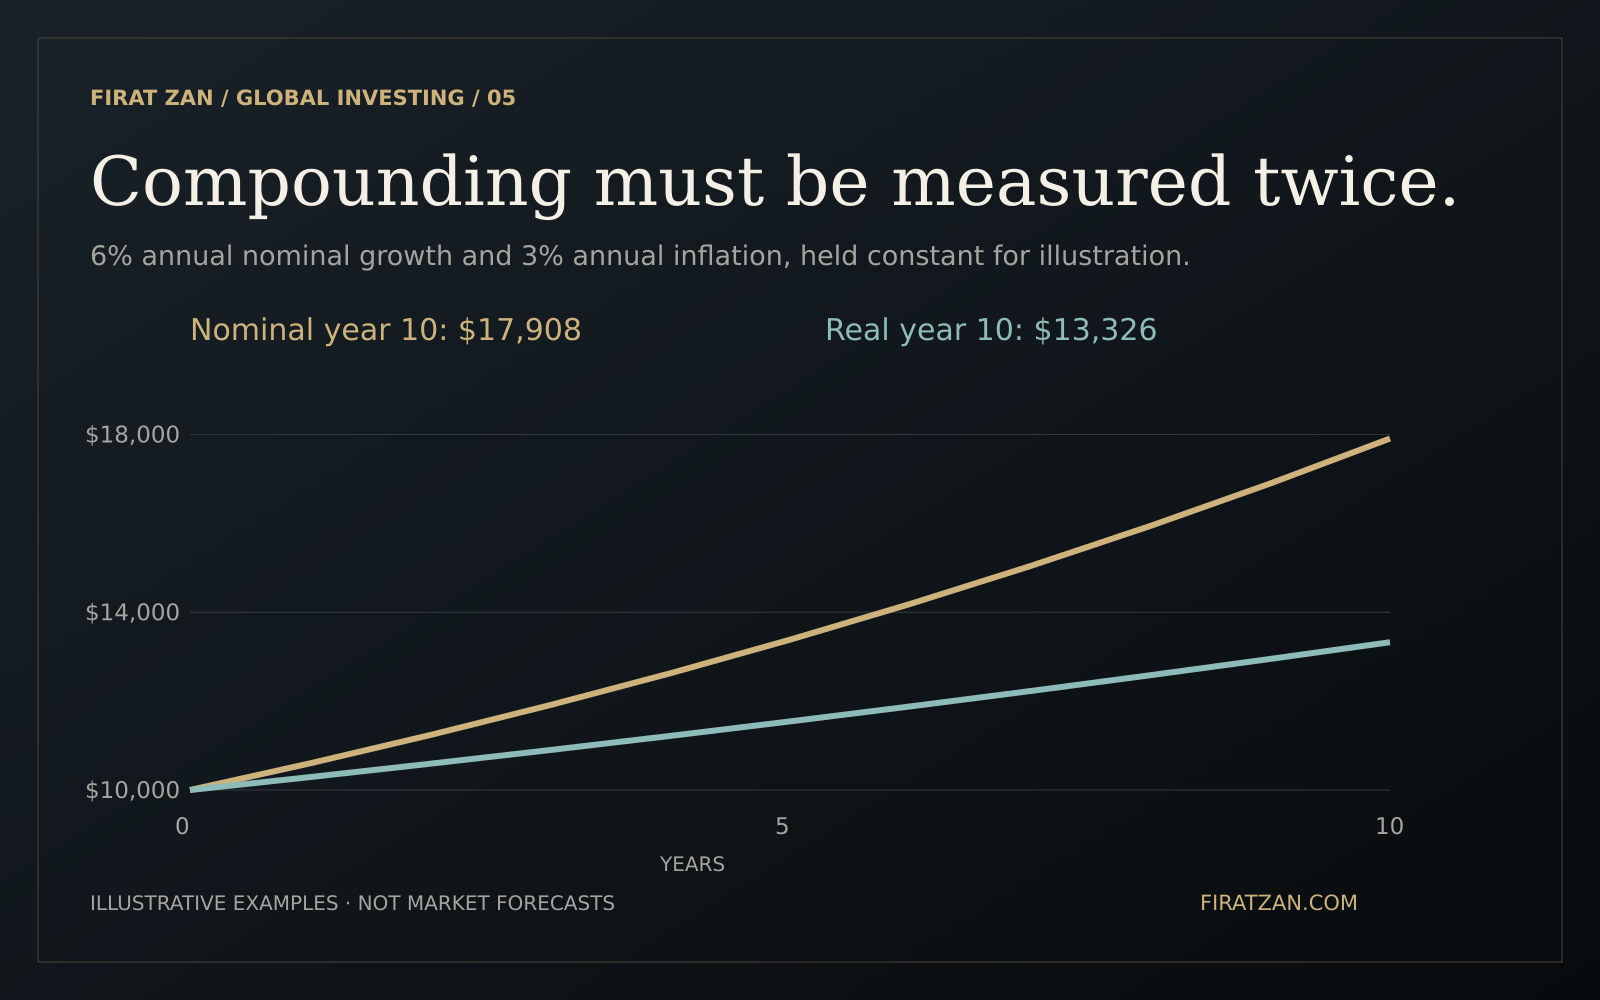
In a simplified ten-year scenario, $10,000 growing at a constant 6% nominal rate becomes approximately $17,908. If inflation is a constant 3% annually, the ending balance is worth approximately $13,326 in starting-year purchasing power. The nominal increase is about 79.08%; the real increase is about 33.26%. This illustration excludes fees and taxes.
This does not mean that long-term investments are unattractive. It means the target should be expressed clearly. A future balance and the purchasing power of that balance answer different questions. Planning around both makes it easier to see whether progress is keeping pace with the goal.
Deposits and withdrawals add another layer. New savings can increase a portfolio balance even when its investment performance is weak. When cash flows occur at different dates, distinguish the investor's money-weighted experience from the investment's time-weighted performance. The simple examples in this article assume no intervening external cash flows.
6. Compare like with like before comparing percentages
A rental yield, a capital gain and a fund's total return are not interchangeable figures. Income is only one part of total return; selling costs, operating expenses and changes in value may also matter. A yield based on a purchase price cannot automatically be compared with performance measured against today's market value.
Similarly, a two-year gain should not be placed next to an annual return without explaining the difference. A 20% total gain over two years is approximately 9.54% annualized before costs and inflation, assuming no external cash flows. Dividing 20% by two misses the effect of compounding.
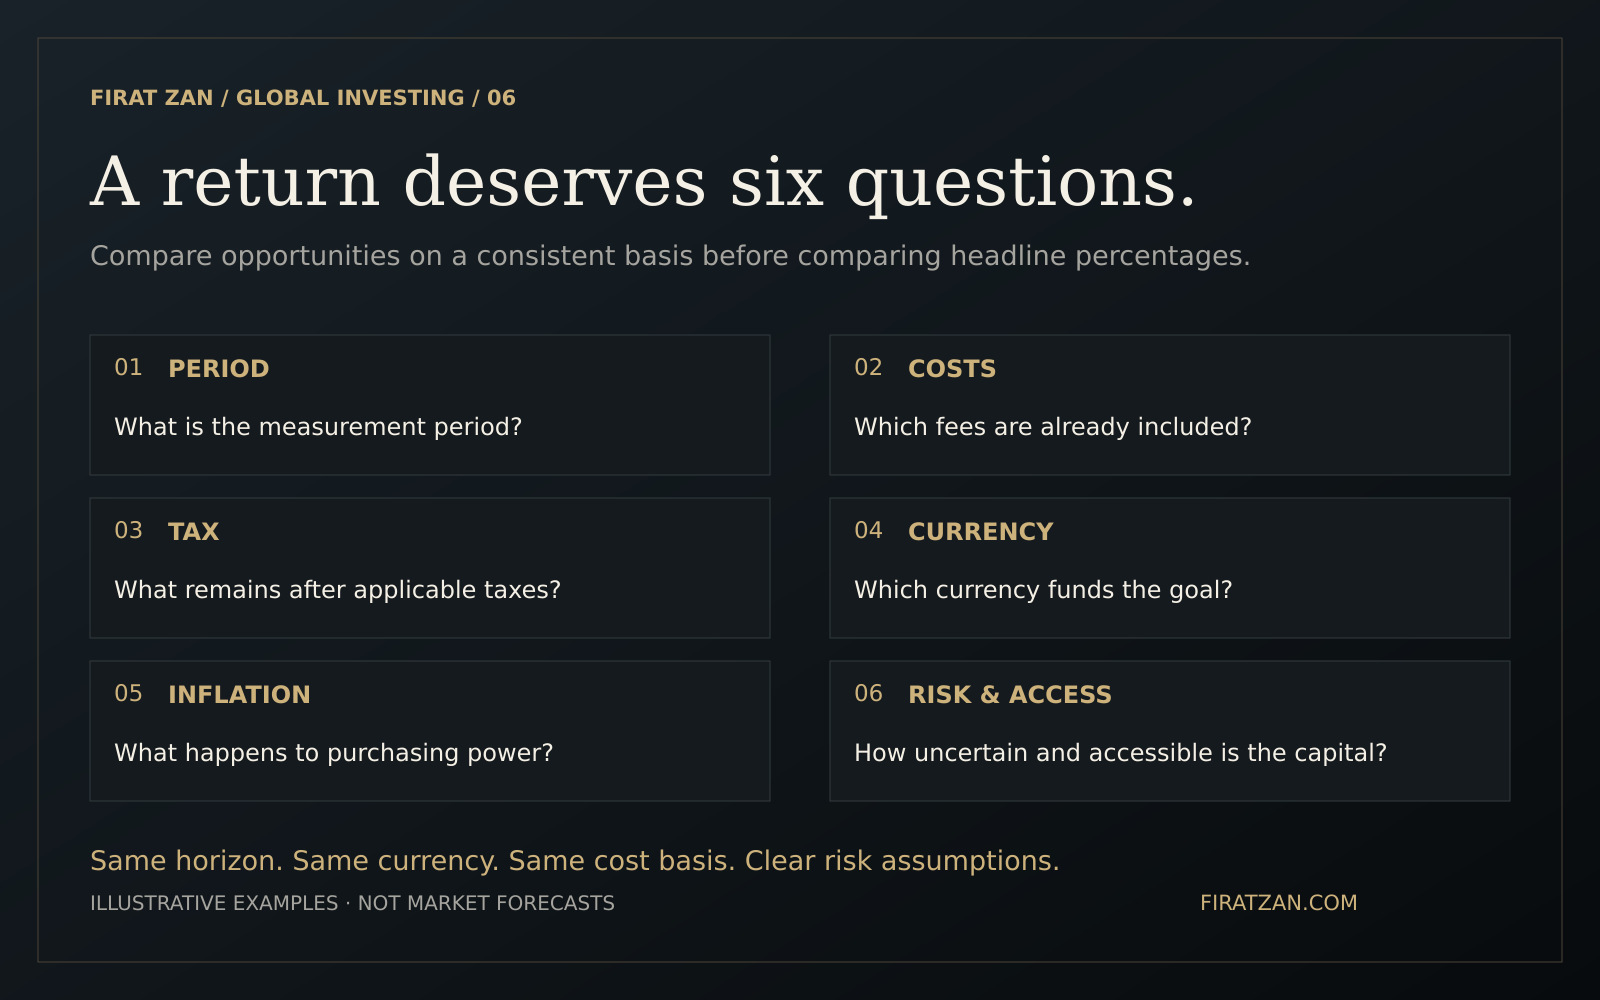
A higher estimated real return does not automatically make an investment preferable. A forecast remains uncertain, a historical result may not repeat, and a return from capital locked away for years carries a different practical meaning from readily accessible capital. The measurement becomes more useful when it sits beside those conditions.
That connects this guide to my earlier discussions of liquidity and optionality and global diversification. Capital needs an understandable return, but it also needs a role, an appropriate risk level and a time horizon that fits the investor's commitments.
For me, the useful question is how much usable purchasing power remains after the investment has done its work. Answering it requires more than a headline. It requires a consistent currency, transparent costs and a clear view of what the money is meant to achieve.
All numerical examples and infographics are hypothetical calculations prepared for this guide. Rounded display values may differ slightly from unrounded results. They do not represent market forecasts, personal investment results or a specific tax regime.
Conceptual references: ECB: nominal and real rates; Investor.gov: international investing; Investor.gov: fees and expenses. Educational analysis by Firat Zan.