Portfolio Concentration Risk: When More Investments Mean the Same Bet — Firat Zan
More properties, funds or accounts do not automatically create diversification. Firat Zan explains how to uncover shared risks, measure overlapping exposures and test a portfolio before adding the next investment.

A portfolio can become larger without becoming more resilient. An investor buys a second apartment, adds a property fund, opens another brokerage account and purchases shares in a familiar local bank. The list of investments grows. Yet several of those positions may still depend on the same property cycle, the same financing conditions and the same pool of buyers.
That is the practical problem behind portfolio concentration risk. Counting holdings tells you how many things you own. It does not tell you how many independent sources of return you have, or how many investments could become difficult to sell at the same time. The distinction matters most when an attractive new opportunity appears similar to something that has already worked.
This guide examines concentration through a series of original, hypothetical examples. It connects position sizes, overlapping funds, property exposure, leverage and cash commitments in one review. The objective is to understand what the next investment adds to the whole portfolio, rather than judge it only by its advertised return.
1. Start with the economic bet behind each holding
Concentration means a substantial part of a portfolio depends on a particular investment, market or common source of risk. FINRA identifies several ways this can happen, including deliberate large positions, investments growing faster than the rest of a portfolio, correlated holdings and assets that are difficult to sell. Its guidance also emphasizes checking the underlying holdings of funds, because separate fund names can conceal overlapping positions.
For a practical review, write a short explanation of what must go right for each investment. An apartment might depend on tenant demand and affordable buyer financing. A developer share might depend on profitable new sales. A local lender might depend on borrowers making their payments. The assets have different legal forms, but their outcomes may be affected by a common slowdown.
The question is therefore specific: if one part of the economy weakens, which other holdings would feel the same pressure? This question does not require a forecast. It requires a map of dependencies. An investor can be comfortable accepting a shared exposure while still recognizing that buying another instrument has not removed it.
2. Calculate position weights using a consistent balance sheet
Begin with current estimated values in one reporting currency and record the valuation date. For each position, note its legal owner, outstanding debt, restrictions on sale and the source of the valuation. Comparing one asset at purchase cost with another at an optimistic resale estimate can make the resulting weights misleading before the analysis even begins.
Use separate views for gross assets and net equity when borrowing is involved. A property worth $300,000 with a $180,000 loan contributes $120,000 of equity, but its market exposure is still based on the $300,000 asset. The mortgage belongs in the analysis rather than disappearing inside a net number. A gross-asset weight answers a different question from an equity weight.
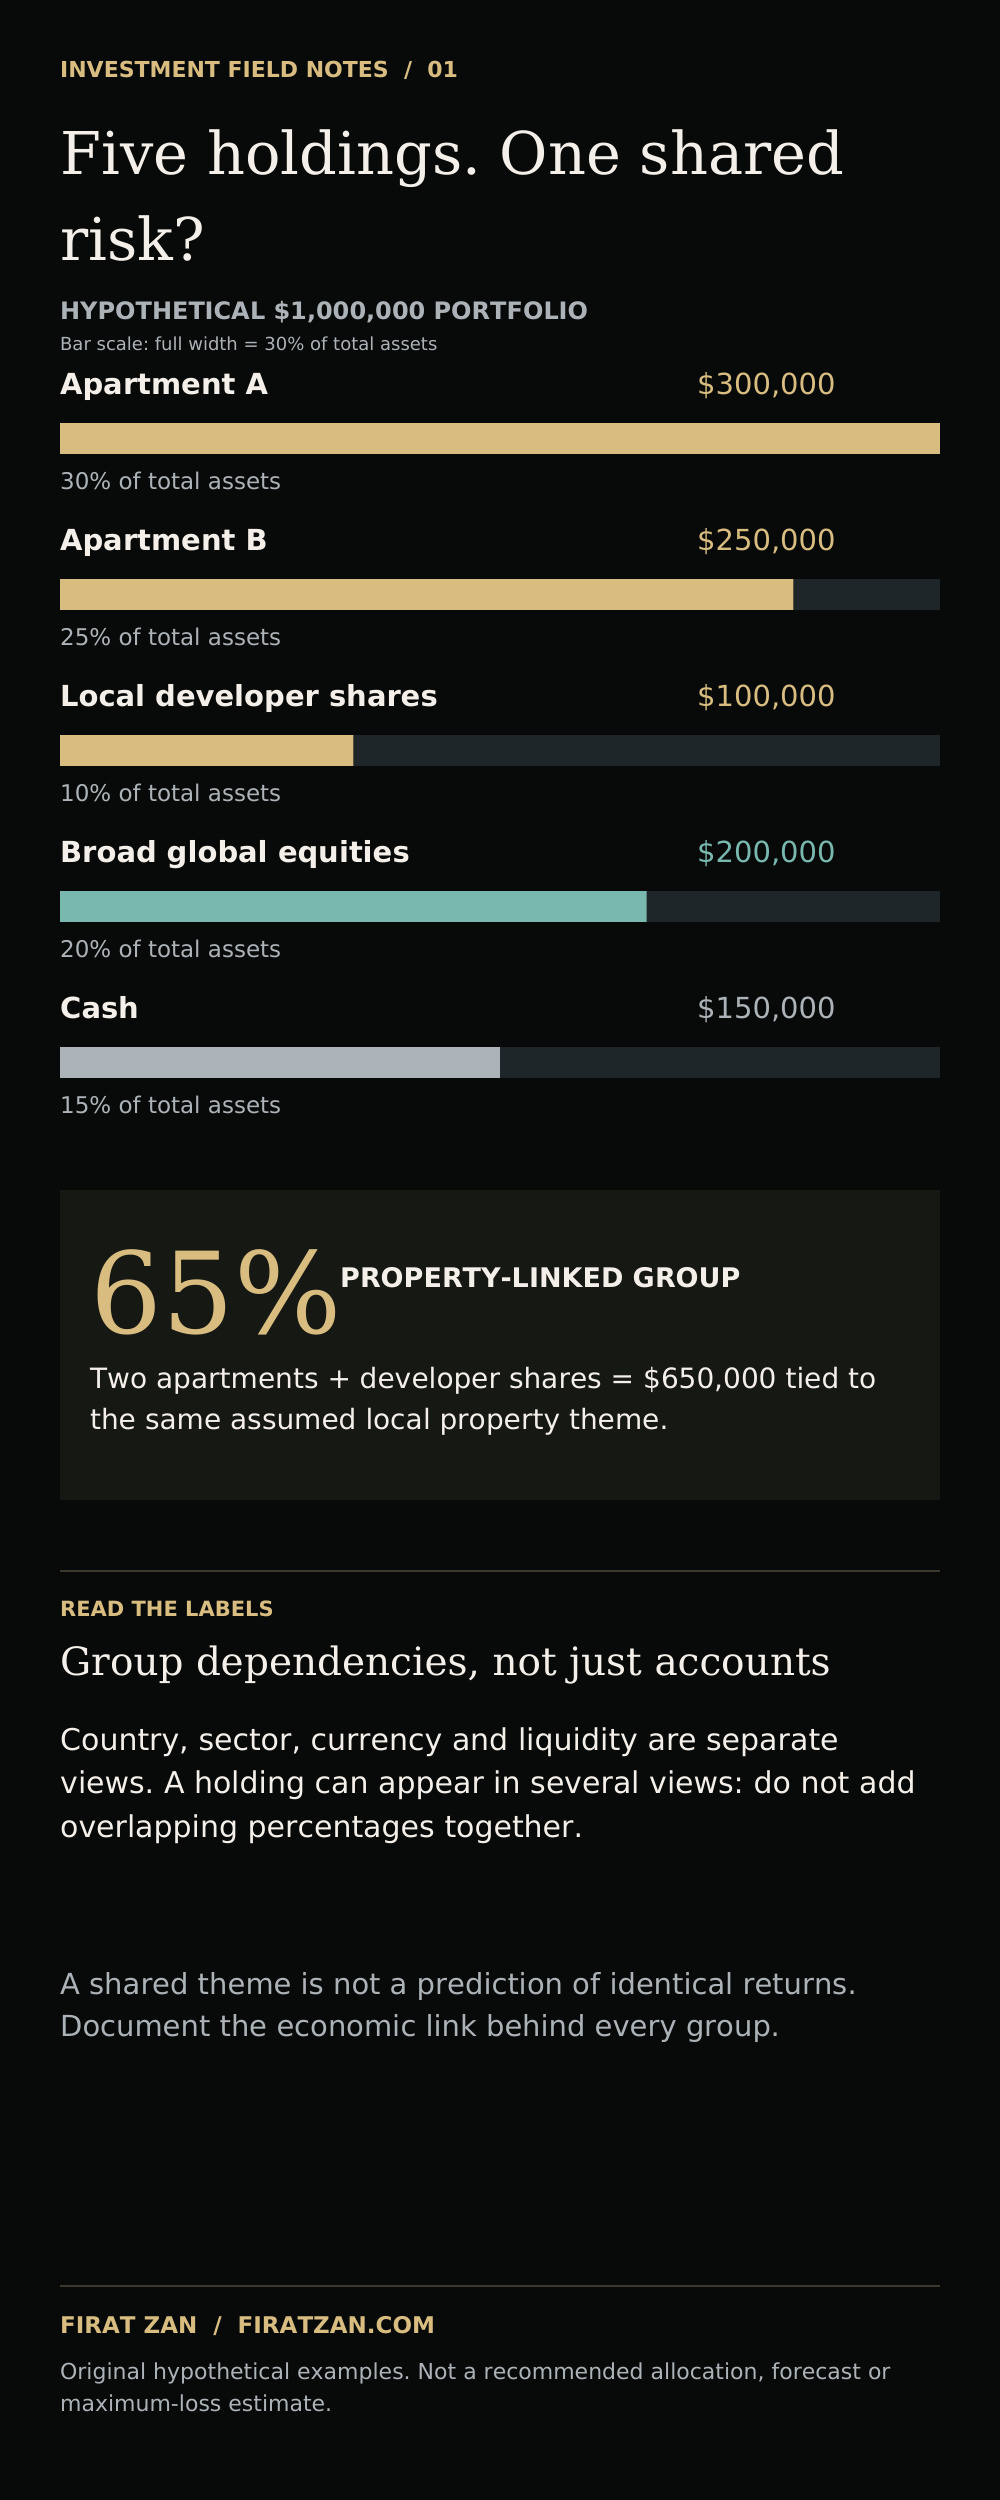
For an unlevered illustration, assume a $1,000,000 portfolio consisting of $300,000 in Apartment A, $250,000 in Apartment B, $100,000 in local developer shares, $200,000 in broad global equities and $150,000 in cash. These are five accounting lines, with respective weights of 30%, 25%, 10%, 20% and 15%. The numbers are teaching assumptions, not a recommended allocation or a description of any person's holdings.
3. Group shared exposures without adding them twice
In this illustration, both apartments and the developer shares are assumed to be connected to the same local property market. Together, they represent $650,000, or 65% of total assets. That figure is a scenario grouping: it describes the capital assigned to the common theme. It does not mean those investments will experience identical losses or have identical risk.
Build other views separately. One can group investments by country, another by sector, another by currency and another by liquidity. A single apartment may appear in several views because it has several characteristics. Never add these overlapping percentages into a supposed total risk score. A 55% property weight plus a 65% country weight does not mean 120% of the portfolio has been invested.
The purpose is to see concentrations that a simple holdings list hides. A useful exposure table has a column explaining why a position belongs in a group. Where the relationship is uncertain, mark it as an assumption to investigate. The map should support judgment rather than create an illusion of statistical precision.
4. Look through funds and accounts to the actual companies
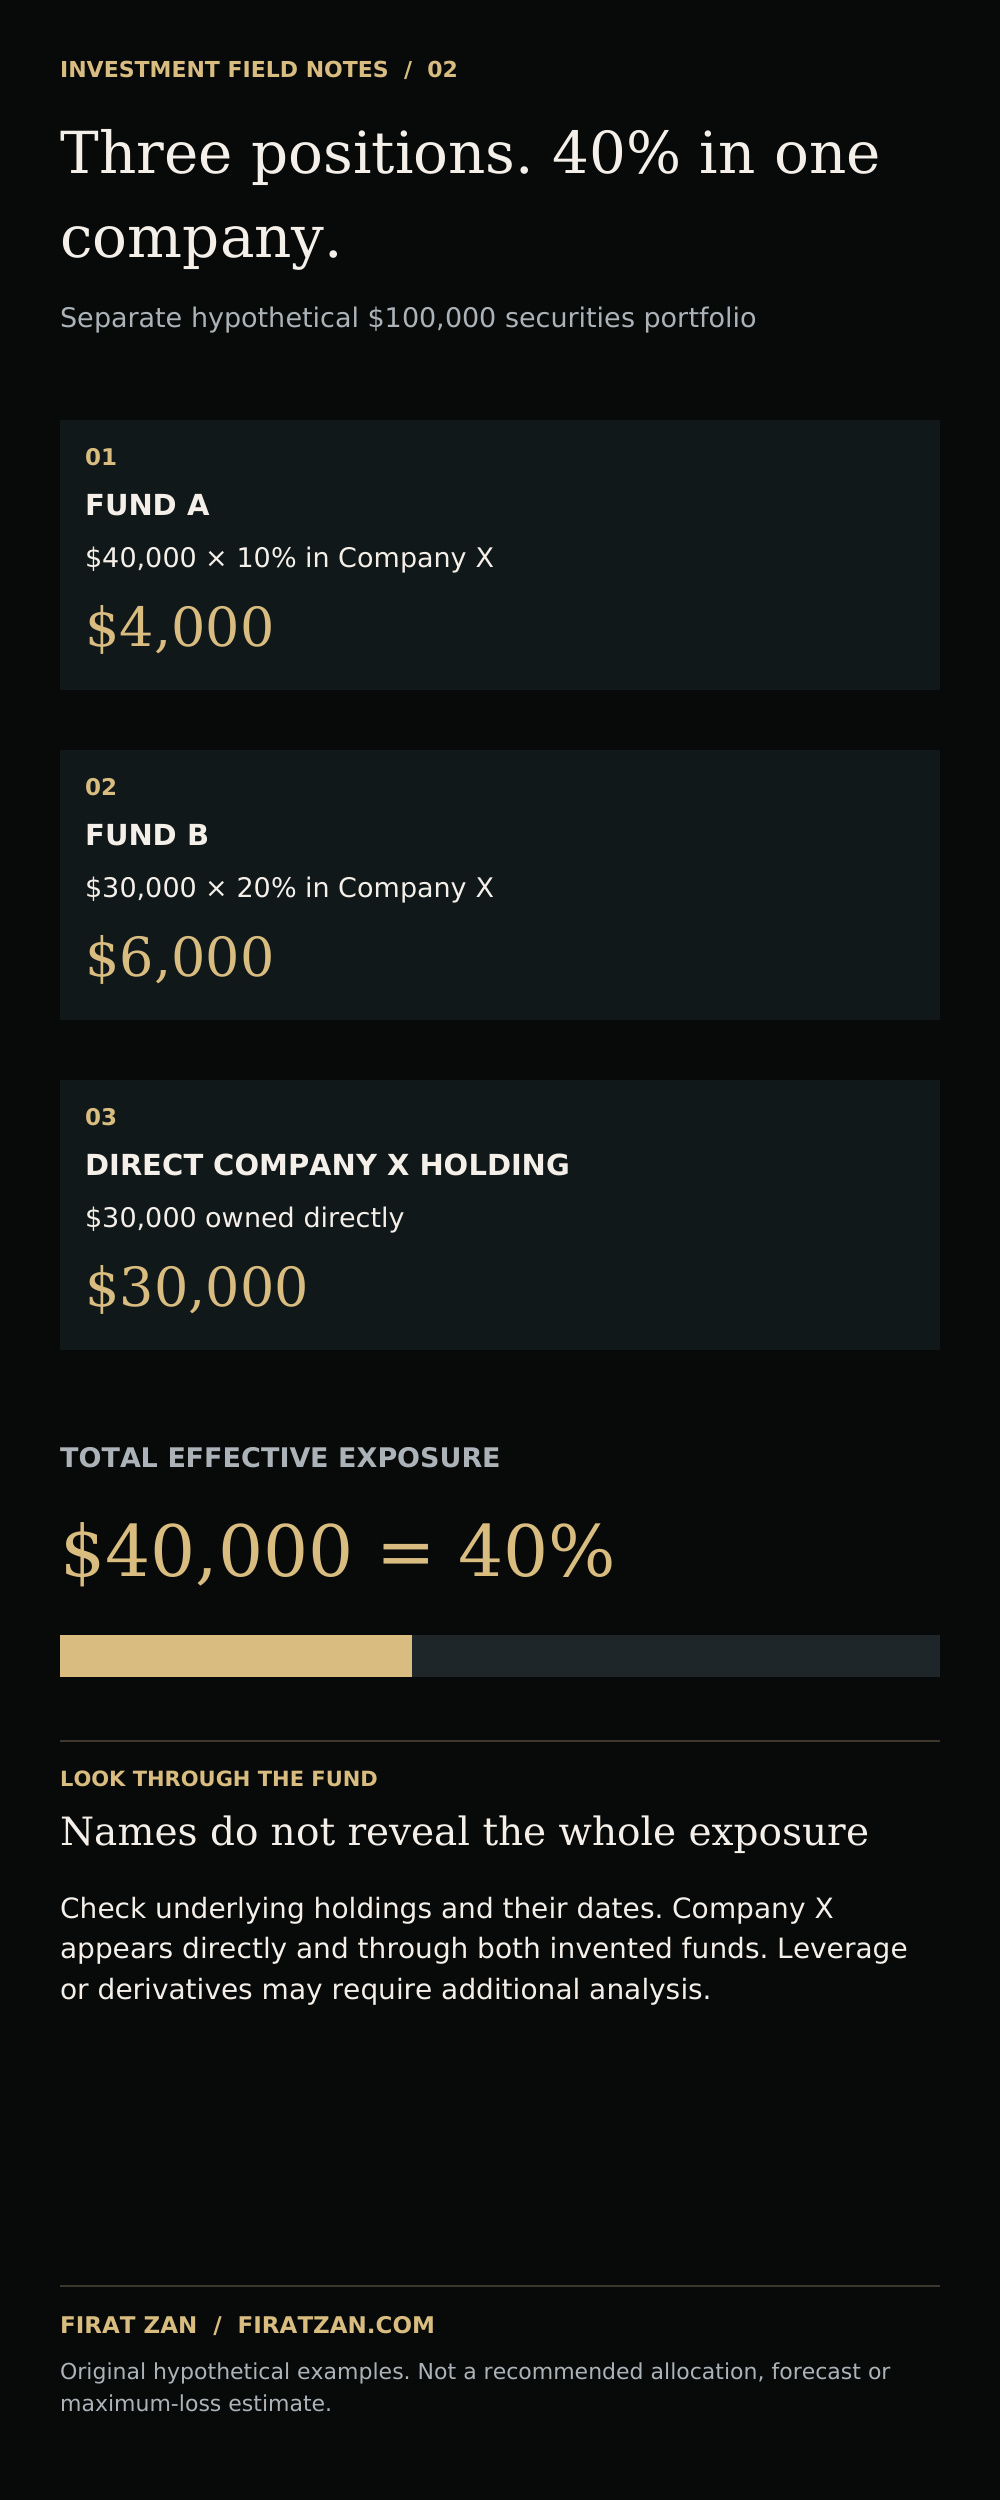
Consider a second, separate example: a $100,000 securities portfolio holds $40,000 in Fund A, $30,000 in Fund B and $30,000 directly in Company X. Assume Company X represents 10% of Fund A and 20% of Fund B at the chosen reporting date. Indirect exposure is $4,000 through the first fund and $6,000 through the second.
Add the $30,000 direct position and the effective exposure to Company X becomes $40,000, or 40% of the portfolio. The investor owns three positions, but one company accounts for two-fifths of the capital on a look-through basis. No actual fund or issuer is implied by these invented labels and weights.
Use current holdings reports rather than assume yesterday's weights still apply. If a fund invests in other funds, another layer may need examination. Derivatives and leverage can make a simple holdings-based calculation incomplete. In such cases, record what the available disclosure does and does not show instead of pretending that every exposure can be reduced to one exact number.
5. Separate the asset's location from its currency exposure
A different country address does not automatically mean an independent economic exposure. Two overseas properties might rely on similar tourist demand, international buyers or external financing. Conversely, two investments in one country may have different revenue sources. Geographic labels are useful starting points, but the underlying customers, contracts and funding arrangements deserve attention.
Record purchase currency, income currency, expense currency and debt currency separately. A brokerage account displayed in dollars does not establish that every business held inside earns dollars. Equally, the currency in which an exchange-traded fund trades is not a complete description of its underlying currency risks or any hedge it uses.
For property, ask whether rent and debt payments are naturally matched, and whether a major future payment will require converting another currency. The analysis is especially useful before signing a new commitment. An investment may appear affordable at today's exchange rate while creating a larger funding requirement if the payment currency strengthens before settlement.
6. Test a shared shock across the entire portfolio
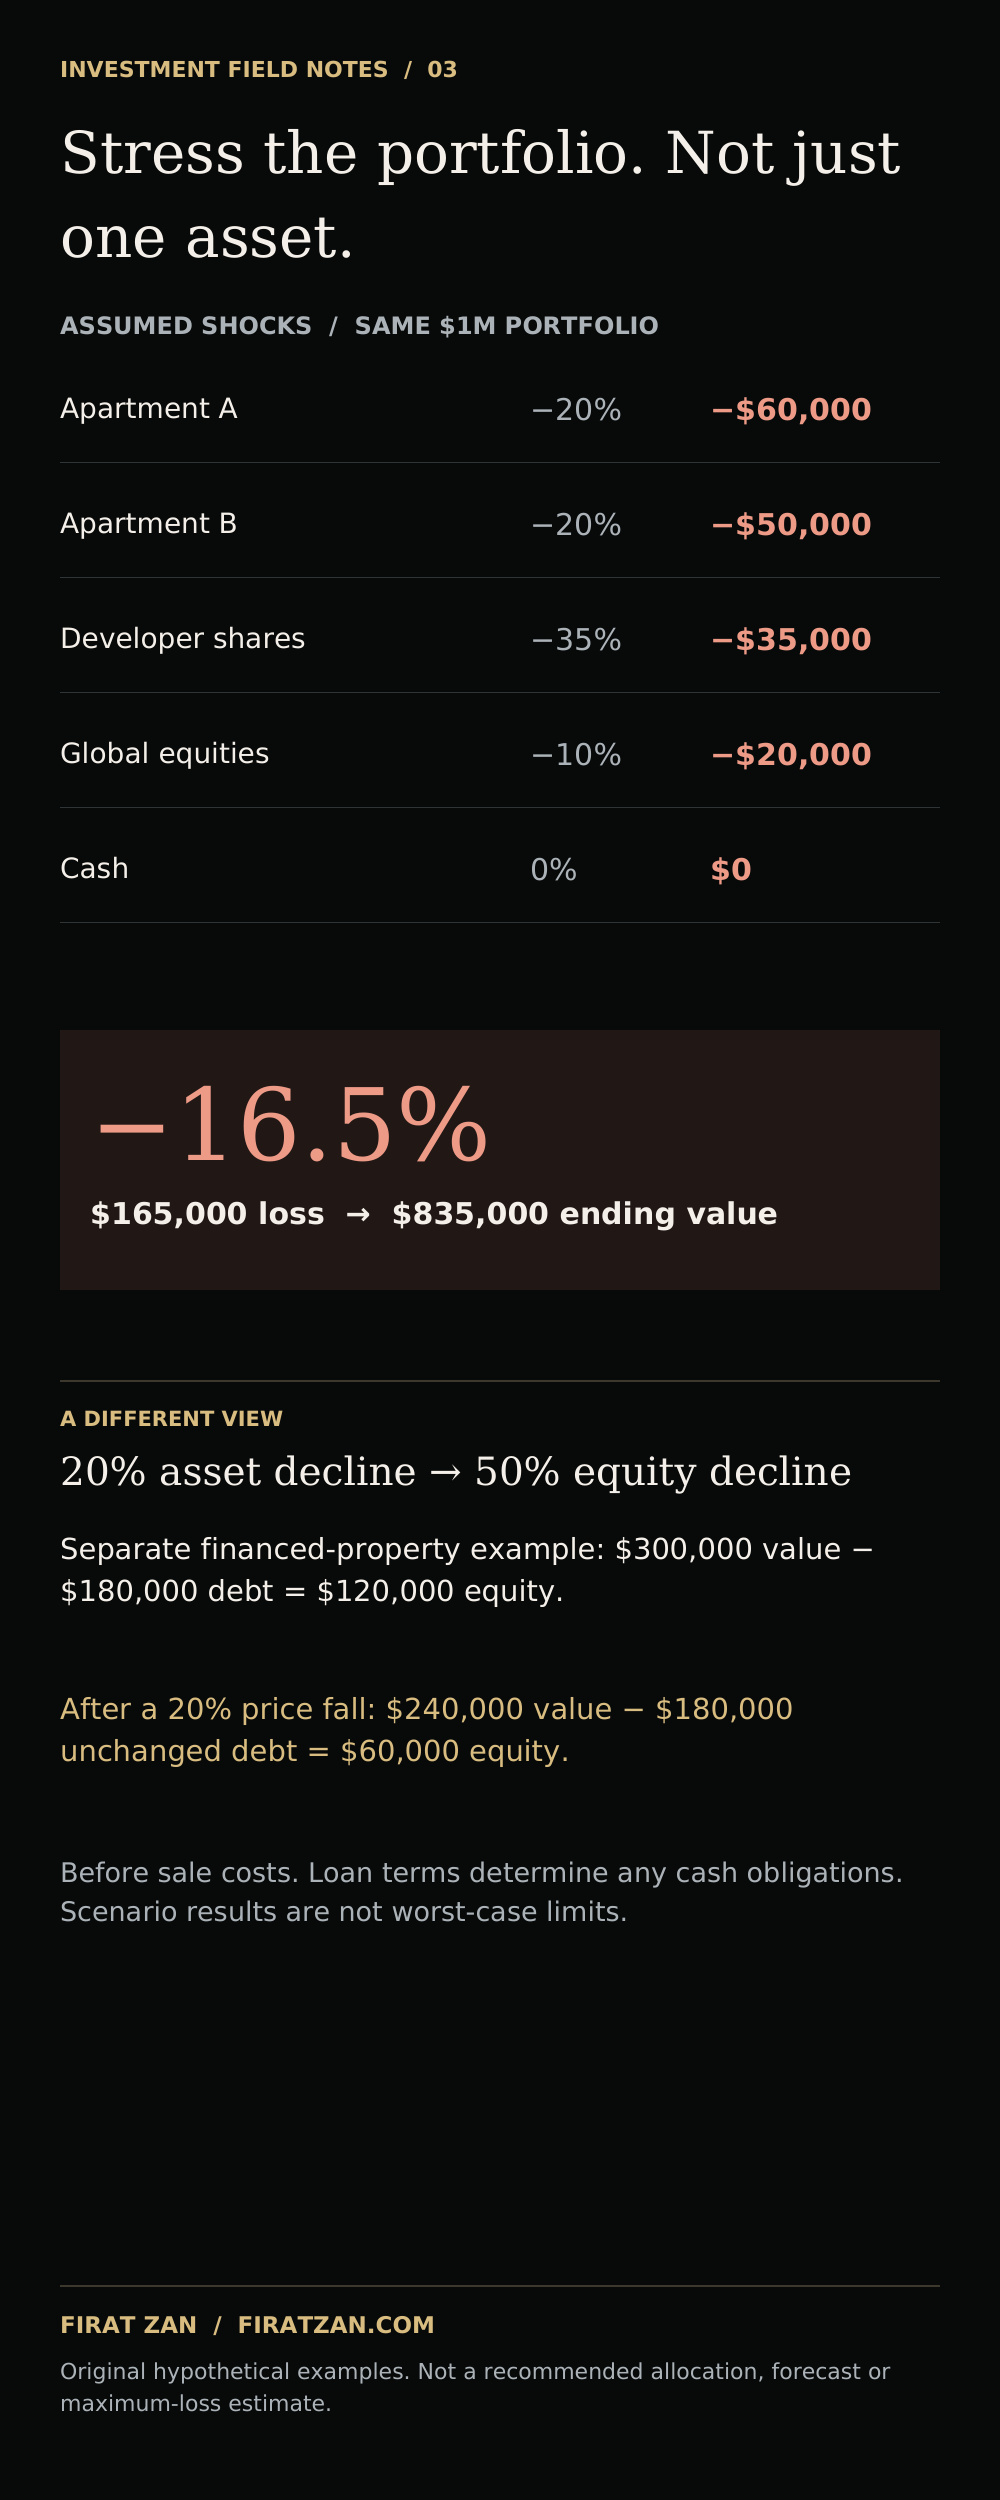
Return to the hypothetical $1,000,000 portfolio. Apply an illustrative stress: both apartment values fall by 20%, local developer shares fall by 35%, global equities fall by 10%, and the cash balance remains unchanged in the reporting currency. The assumptions are deliberately explicit. They are neither forecasts nor estimates of how these markets will behave together.
Apartment A loses $60,000 and Apartment B loses $50,000. Developer shares lose $35,000, while global equities lose $20,000. The total modeled decline is $165,000, or 16.5%, leaving $835,000. Of that decline, $145,000 comes from the three positions grouped under the local property theme. The calculation shows where this particular scenario puts pressure on capital.
Change the assumptions and the answer changes. Run several plausible narratives rather than treating one stress as a complete model. A property slowdown, a currency move and an interruption to investment income ask different questions. A stress test helps reveal vulnerabilities; it cannot establish the maximum possible loss or the probability of a scenario.
7. Leverage can make the equity concentration much sharper
A separate property example shows why net equity needs its own review. Assume a property is worth $300,000 and has a $180,000 outstanding loan. Owner equity is $120,000. If the asset value falls by 20% to $240,000 while the debt remains unchanged, equity falls to $60,000. A 20% asset decline has produced a 50% equity decline before any sale costs.
This does not mean every price movement produces a cash payment demand. Loan terms, collateral rules and repayment schedules determine what happens in practice. However, scheduled debt service still has to be funded. A decline in rent at the same time as a difficult refinancing period can create a cash problem even when the investor intends to hold the asset.
For every financed position, put the asset value, debt balance, payment schedule and maturity date on the same page. Avoid judging a leveraged investment solely by its income yield or its small initial equity contribution. The denominator that makes a projected equity return look attractive also magnifies the effect of losses.
8. Measure available cash after existing commitments
The $150,000 cash balance in the main example appears to represent a 15% liquidity allocation. Now assume $90,000 is already reserved for a contractual purchase installment and another $20,000 is allocated to a known capital expense. Uncommitted cash is $40,000. That is 4% of the original $1,000,000 asset base, using this specific management definition.
Do not automatically subtract those future payments a second time from net worth if the related assets or liabilities are already included elsewhere. This is a cash-availability calculation, not a complete accounting balance sheet. Its purpose is to show how much money can be deployed without drawing on amounts earmarked for existing obligations.
Keep expected receipts separate from cleared funds. A planned property sale may close late, an invoice may be paid after its expected date, or an investment distribution may vary. A dated schedule of committed payments and available funding makes these timing dependencies visible before a new investment competes for the same cash.
9. Ask what the next purchase changes
Suppose the investor uses $100,000 of the example portfolio's cash to buy another property in the same local market. Ignore transaction costs for this illustration and hold every other value constant. Total assets remain $1,000,000, but the common property-linked group rises from $650,000 to $750,000. Its share increases from 65% to 75%, while cash falls from $150,000 to $50,000.
The new asset may have a reasonable price and credible rent. It may still increase dependence on the same market. That is not automatically an argument against buying it. It is an argument for describing the trade-off accurately: more of the same exposure, funded with part of the portfolio's most immediately available capital.
Compare the portfolio before and after the proposed purchase. Recalculate the main exposure groups, future cash requirements and stressed outcomes. This marginal view is often more useful than asking whether the investment is attractive in isolation. The opportunity has to fit an existing set of commitments rather than an empty spreadsheet.
10. Rebalance with costs, timing and evidence in view
Investor.gov explains asset allocation as dividing investments among categories according to objectives, time horizon and risk tolerance. It describes rebalancing as adjusting a portfolio back toward its intended allocation and notes that transaction fees and tax consequences matter. Diversification can reduce some risks, but it cannot guarantee that a portfolio avoids losses when markets decline.
For a property-heavy portfolio, changing an exposure may take time. A sale has a negotiation process and costs, while a liquid securities position may be adjustable sooner. The right implementation depends on contracts, tax treatment and the investment case. A review can identify a problem immediately without making immediate liquidation the best response.
An investor might redirect future contributions, retain distributions, pause an additional purchase or consider a gradual disposal. These are possible mechanisms, not universal instructions. Evaluate the costs and practical effects of each. A portfolio policy is useful when it defines what triggers a review, who verifies the information and how a proposed change will be evaluated.
11. Use a repeatable concentration review
A practical review begins with five records: a dated asset-and-debt inventory, a table of overlapping economic exposures, underlying fund holdings where available, a payment and liquidity schedule, and several clearly labeled stress scenarios. Keep source documents beside the assumptions. An estimate should remain visibly different from a bank balance or a contractual payment.
Then write a short answer to six questions. Which single holding is largest? Which economic theme links the most capital? Which underlying issuer appears repeatedly? What payments could arrive at the same time? What can actually be sold within the required period? How would the next investment change each answer? These questions turn a broad diversification discussion into a decision process.
There is no single concentration percentage that is suitable for everyone. Capacity to absorb loss, debt, reliable outside income, investment horizon and exit options all affect the decision. The most useful outcome is an honest description of dependence: what the portfolio needs to go right, what could fail together and which commitments would still need funding.
Frequently asked questions
Does owning more properties automatically diversify a portfolio?
It can spread building-specific and tenant-specific risks, but properties in one market may still share demand, financing and exit risks. Examine both the individual assets and their common drivers.
Do several funds eliminate concentration?
Not necessarily. Different funds can hold the same companies. In the article's invented example, a direct position plus two indirect fund positions creates 40% exposure to one issuer.
Is the 65% example a recommended limit?
No. It is a hypothetical grouping used to explain the arithmetic. The appropriate exposure depends on the investor's circumstances and the risks being measured.
Can a stress test tell me the maximum loss?
No. It shows the outcome of the assumptions entered. Real outcomes can be worse, relationships can change and additional costs or funding needs may arise.
Sources and method
General educational principles: FINRA — Concentrate on Concentration Risk and Investor.gov — Asset Allocation and Diversification. All portfolio amounts, fund weights and stress scenarios in this article are original hypothetical teaching examples. They do not describe Firat Zan’s assets or constitute a market forecast or individual investment recommendation.
Continue reading
Global Diversification: Countries, Currencies and Asset Classes