
How much money do you need to retire? A useful starting estimate is the annual spending your investments must fund divided by an assumed initial withdrawal rate. The harder work is making sure the spending, income, portfolio and time horizon behind that estimate are realistic.
A round target such as $1 million can be motivating, but it says little by itself. Someone spending $2,000 a month, with dependable pension income, has a different requirement from someone spending $6,000 a month without outside income. Retirement planning becomes clearer when the target is built from the life it needs to support.
This guide explains the FIRE number, the arithmetic behind the 25-times rule, the limits of a 4% withdrawal assumption and the adjustments that make the estimate more useful. FIRE stands for Financial Independence, Retire Early. The calculations use hypothetical dollar amounts; another currency works if the spending, income and portfolio are measured consistently.
1. Build the target from spending, not current salary
Your salary can help measure saving capacity, but retirement spending is what the portfolio ultimately needs to support. Start with the costs of housing, utilities, food, transport, insurance, healthcare, travel and family commitments. Separate essentials from spending that could be reduced if conditions changed.
Use actual records where available. Twelve months of statements can reveal annual charges that disappear from a one-month budget. Include repairs, replacement equipment, insurance renewals and travel that happens only once or twice a year. A monthly average built from a full year is often more informative than an unusually quiet month.
Then adjust for how retirement could change the budget. Work-related transport might fall, while travel or healthcare costs could rise. A mortgage may finish, but property maintenance continues. Supporting relatives or keeping homes in two countries can create commitments that a simple single-household budget misses.
Consider a hypothetical monthly budget of $4,000. Multiplying by twelve produces $48,000 of annual spending. Adding $6,000 a year for irregular but foreseeable costs produces a $54,000 annual requirement. If a calculator uses only the $4,000 monthly figure, it understates this example's requirement by $6,000 before any investment assumptions enter the calculation.
Set aside one-off purchases separately. A planned relocation, large renovation or vehicle replacement should not be casually absorbed into an annual withdrawal estimate. It can be included through a dedicated capital allowance or a clearly defined spending schedule. The point is to count it once, in a form that matches when the money will be needed.
2. Calculate your FIRE number with a transparent formula
First estimate how much of annual spending must come from the portfolio. Subtract dependable outside income from the spending requirement, taking care that both figures use a consistent tax and currency basis. Divide the remaining gap by an assumed initial withdrawal rate.
If the portfolio needs to fund $48,000 in the first year, a 4% assumption produces $1.2 million: $48,000 divided by 0.04. A 3.5% assumption produces approximately $1.37 million. A 3% assumption produces $1.6 million. These are sensitivity calculations showing what changes when the assumption changes.
The familiar 25-times rule is the same arithmetic written differently. One divided by 0.04 equals 25, so an annual spending gap multiplied by 25 produces the 4% illustrative target. At 3.5%, the multiplier is about 28.57. At 3%, it is about 33.33. None of the multipliers establishes that a particular rate will be sustainable.
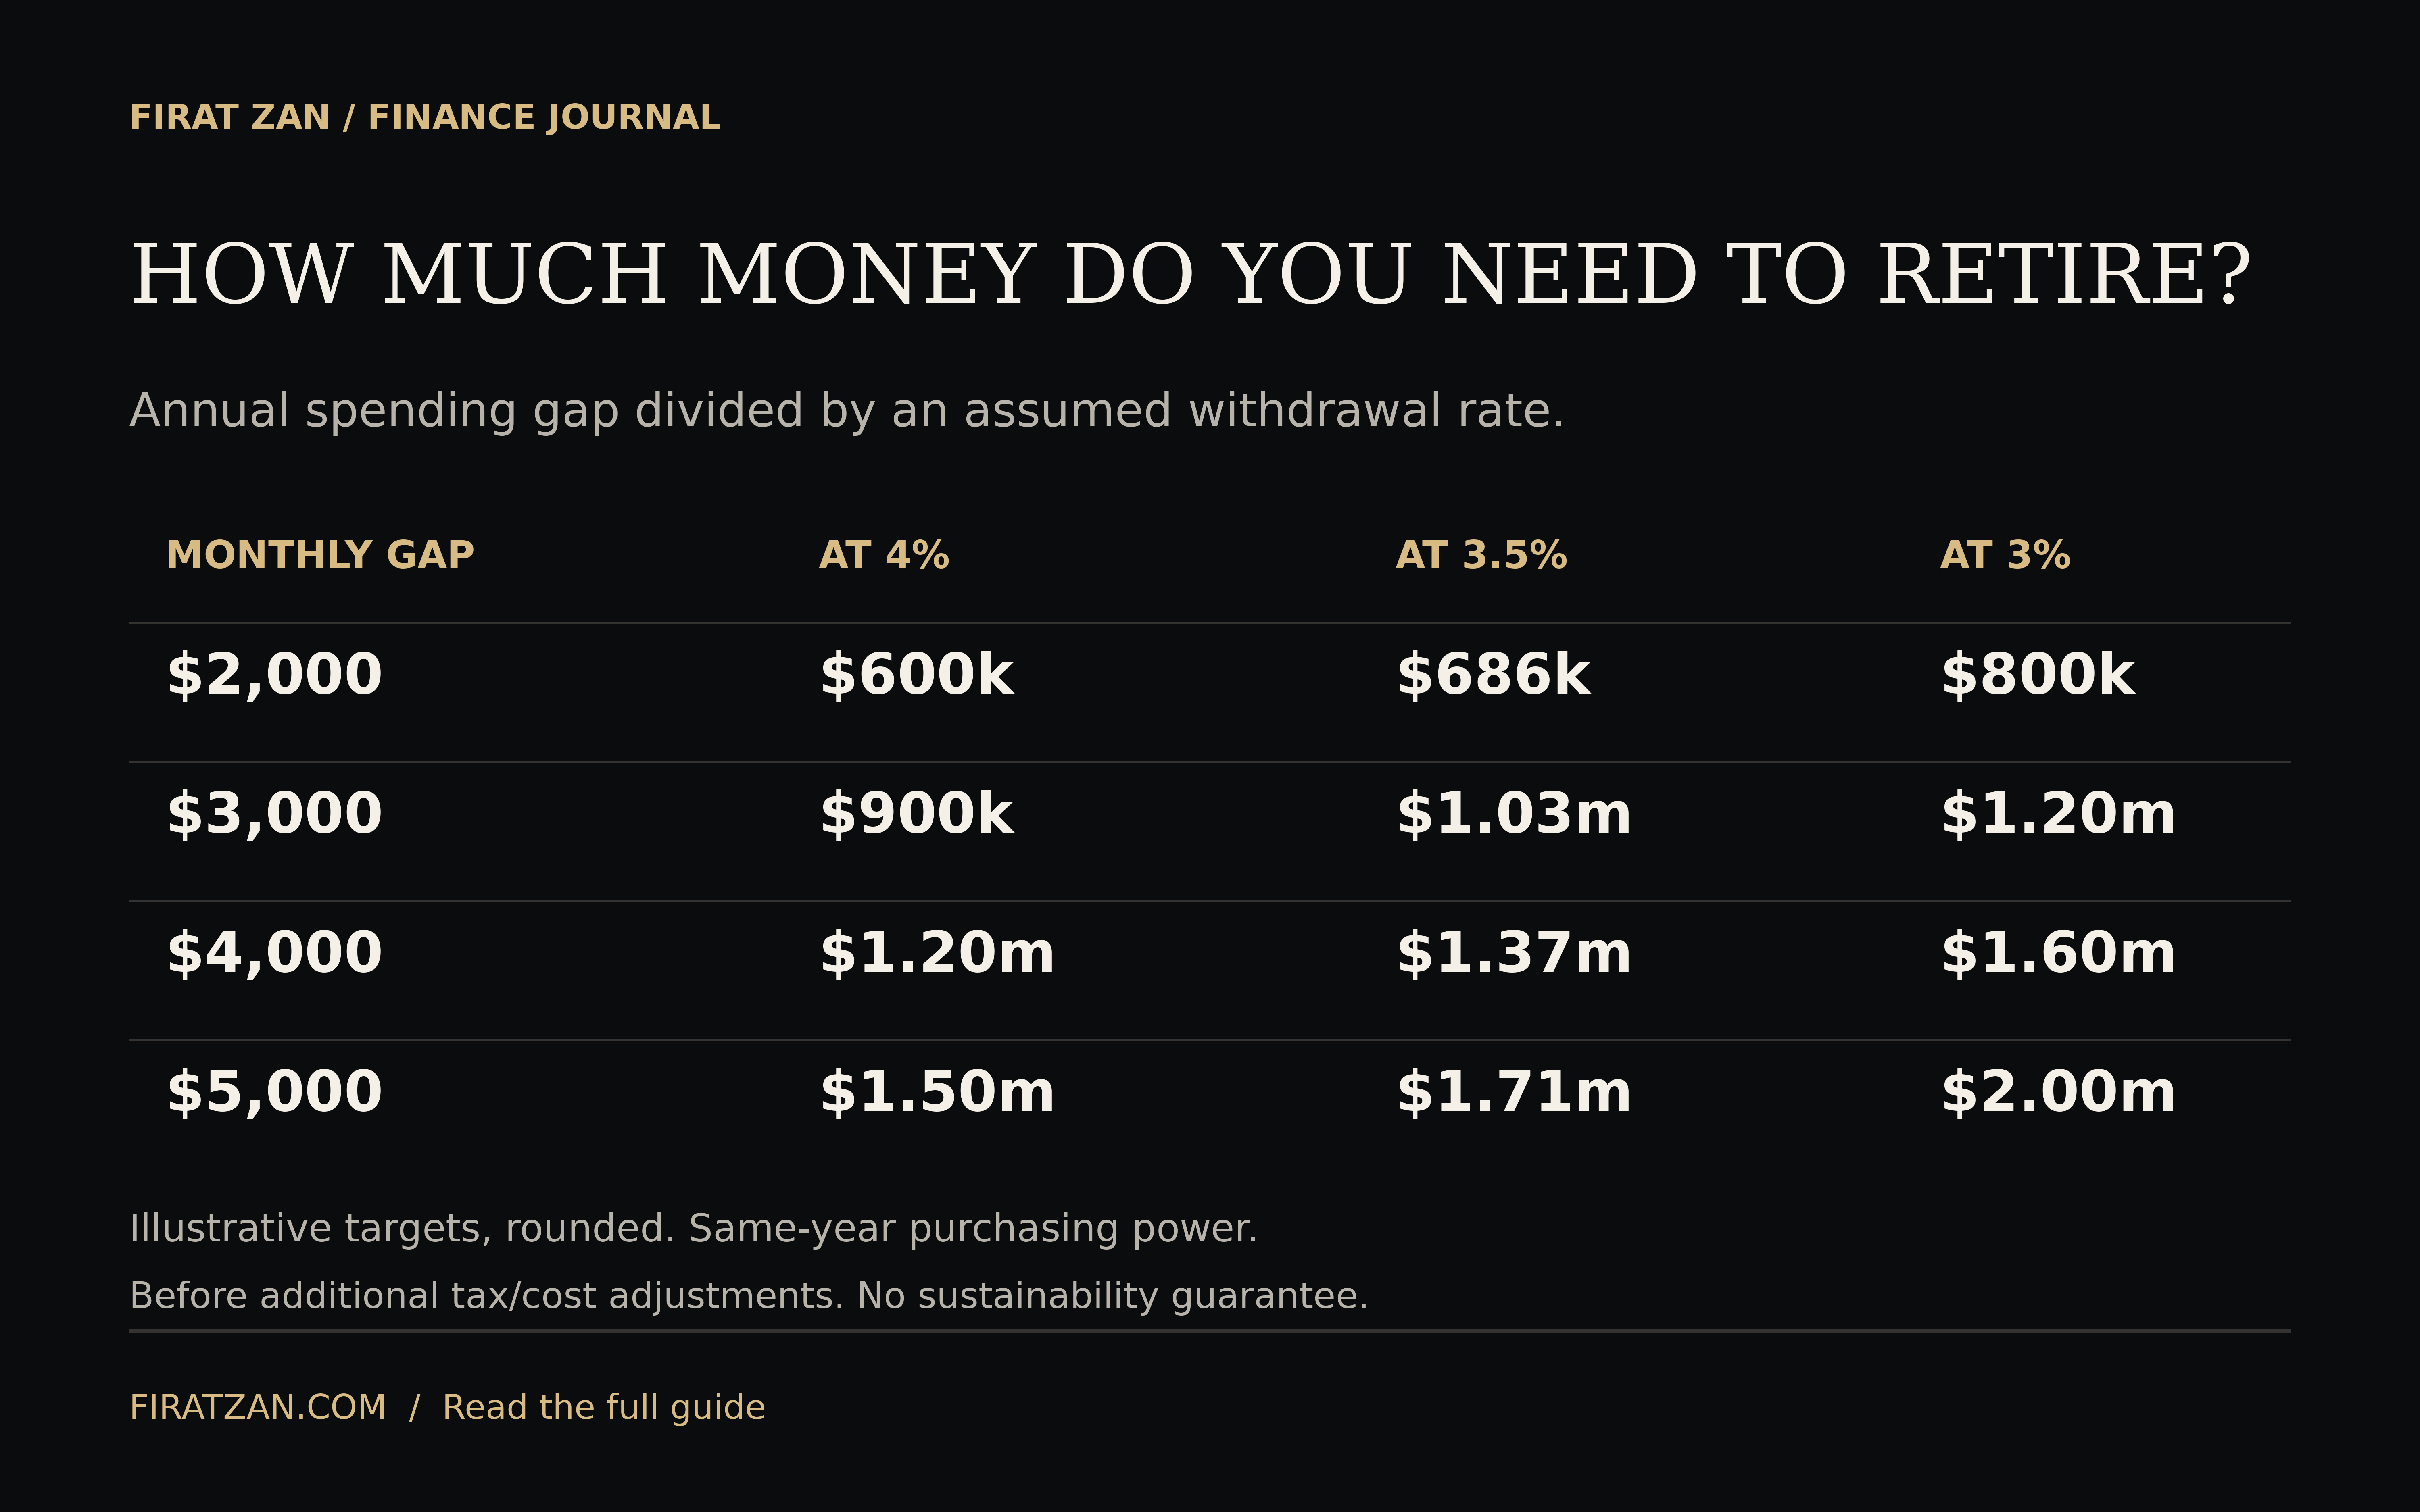
| Monthly portfolio-funded spending | Annual gap | At 4% | At 3.5% | At 3% |
|---|---|---|---|---|
| $2,000 | $24,000 | $600,000 | $685,714 | $800,000 |
| $3,000 | $36,000 | $900,000 | $1,028,571 | $1,200,000 |
| $4,000 | $48,000 | $1,200,000 | $1,371,429 | $1,600,000 |
| $5,000 | $60,000 | $1,500,000 | $1,714,286 | $2,000,000 |
All amounts in the table are in the same year's purchasing power. They assume the stated annual gap is the amount withdrawn and do not establish a tax regime or market forecast. The table is useful for understanding the scale of a target, but it is only the first layer of a retirement plan.
Estimate your FIRE number
Illustrative target: monthly gap × 12 ÷ assumed withdrawal rate. Use one consistent currency and purchasing-power year. Account for taxes, costs and outside income in the spending gap. A withdrawal assumption is not a guarantee.
3. Understand what the 4% rule does and does not mean
A fixed-real withdrawal approach typically begins with a percentage of the initial portfolio and then adjusts that dollar withdrawal for inflation. It is different from taking the same percentage of the current account balance every year. The two methods produce different spending paths, especially after large market movements.
With a $1 million initial portfolio, a 4% first-year withdrawal is $40,000. If the chosen inflation adjustment is 3% for the next year, the second-year withdrawal becomes $41,200 under this method. It does not automatically reset to 4% of the portfolio's new value. That distinction is central to understanding the pressure placed on investments after a weak year.
Research results depend on their assumptions. Morningstar's December 2025 retirement-income study estimated a 3.9% base-case starting rate for consistent inflation-adjusted withdrawals over 30 years, targeting a 90% modeled probability of funds remaining. Its result excluded outside income and used specified portfolio and return assumptions. It is a research estimate with a defined horizon, not a personal guarantee.
Someone retiring early may need capital to last substantially longer than 30 years. Someone with unusually high fixed costs may have little ability to reduce spending after a downturn. A tax regime, concentrated portfolio or different asset mix can also change the result. Importing one headline percentage without importing its assumptions is a poor basis for a permanent decision.
Use multiple withdrawal assumptions to understand sensitivity, then evaluate a rate suited to the actual horizon and portfolio. A lower assumed rate raises the target but does not remove every risk. A flexible spending policy may reduce pressure on the portfolio, but it requires genuine willingness and ability to change spending when needed.
4. Subtract outside income without counting the same asset twice
Pensions, annuities and other dependable income can reduce the amount investments need to provide. Their usefulness depends on start dates, reliability, tax treatment, inflation adjustment and currency. An income stream that starts ten years after retirement cannot fund the preceding ten years without a separate bridge plan.
Suppose annual spending is $60,000 and a reliable income stream available from the start supplies $24,000 on the same basis. The annual gap is $36,000. At a 4% illustrative assumption, the portfolio target is $900,000 rather than $1.5 million. If the income does not keep pace with prices, the future gap can grow and needs to be modeled accordingly.
Rental property requires particular care. Gross rent is not the amount available to spend. Subtract operating costs, service charges, management, vacancy allowances, repairs, debt service and applicable taxes to estimate cash available to the owner. A single unusually good rental year should not be treated as a permanent salary.
If a property remains outside the liquid portfolio, its net rent can be treated as a separate income stream. If its sale proceeds are included in the investment portfolio instead, do not also assume the same property continues paying rent. That would count two incompatible uses of the same asset.
The same distinction applies to a primary residence. A home you continue occupying does not automatically finance withdrawals simply because its market value is large. Selling, downsizing or borrowing against it can change the plan, but those are separate actions with costs and practical consequences. This is why net worth and spendable cash flow need separate columns.
For anyone living between countries, map where income arrives and where expenses are paid. A stable dollar income does not guarantee stable purchasing power for costs in another currency. Keep the reporting currency consistent, and test whether the retirement budget can tolerate unfavorable exchange-rate movements.
5. Taxes and fees can widen the spending gap
The amount a retiree spends and the amount withdrawn from an account can differ. A budget of $48,000 after tax may require more than $48,000 of withdrawals if some of that money is taxed. Different accounts can have different treatment, so a single flat rate can be a poor approximation.
For a deliberately simplified illustration, assume every dollar withdrawn is subject to a hypothetical 20% tax. To retain $48,000, gross withdrawals would need to be $60,000: $48,000 divided by 0.80. At a 4% assumption applied to that gross withdrawal, the target becomes $1.5 million. This is an explanation of grossing up, not the tax treatment of an actual retirement account.
Fees also matter because they reduce capital available to support the plan. Investor.gov recommends understanding purchase, sale and ongoing investment charges. Ask whether the withdrawal model already includes those costs before adding a second allowance. Counting the same fee twice can overstate the target; omitting it can understate the burden.
On a $1.5 million portfolio, an annual charge of 0.5% of that value equals $7,500. That is a meaningful amount alongside a $60,000 spending requirement. The illustration describes scale, not a universal method for subtracting fees from a withdrawal rate. Models can account for costs through net returns, separate cash flows or other defined assumptions.
6. The order of returns matters after withdrawals begin
Two return sequences can produce the same result for untouched capital and different results for a portfolio supporting spending. Withdrawals remove money before it can participate in a later recovery. A disappointing period near the beginning of retirement can therefore matter more than the same period arriving later.
Consider a simplified $100,000 portfolio with $10,000 withdrawn at the beginning of each of two years. In the first sequence, returns are negative 20% and then positive 25%. The balance becomes $72,000 after year one and $77,500 after year two. In the reverse sequence, the ending balance is $82,000.
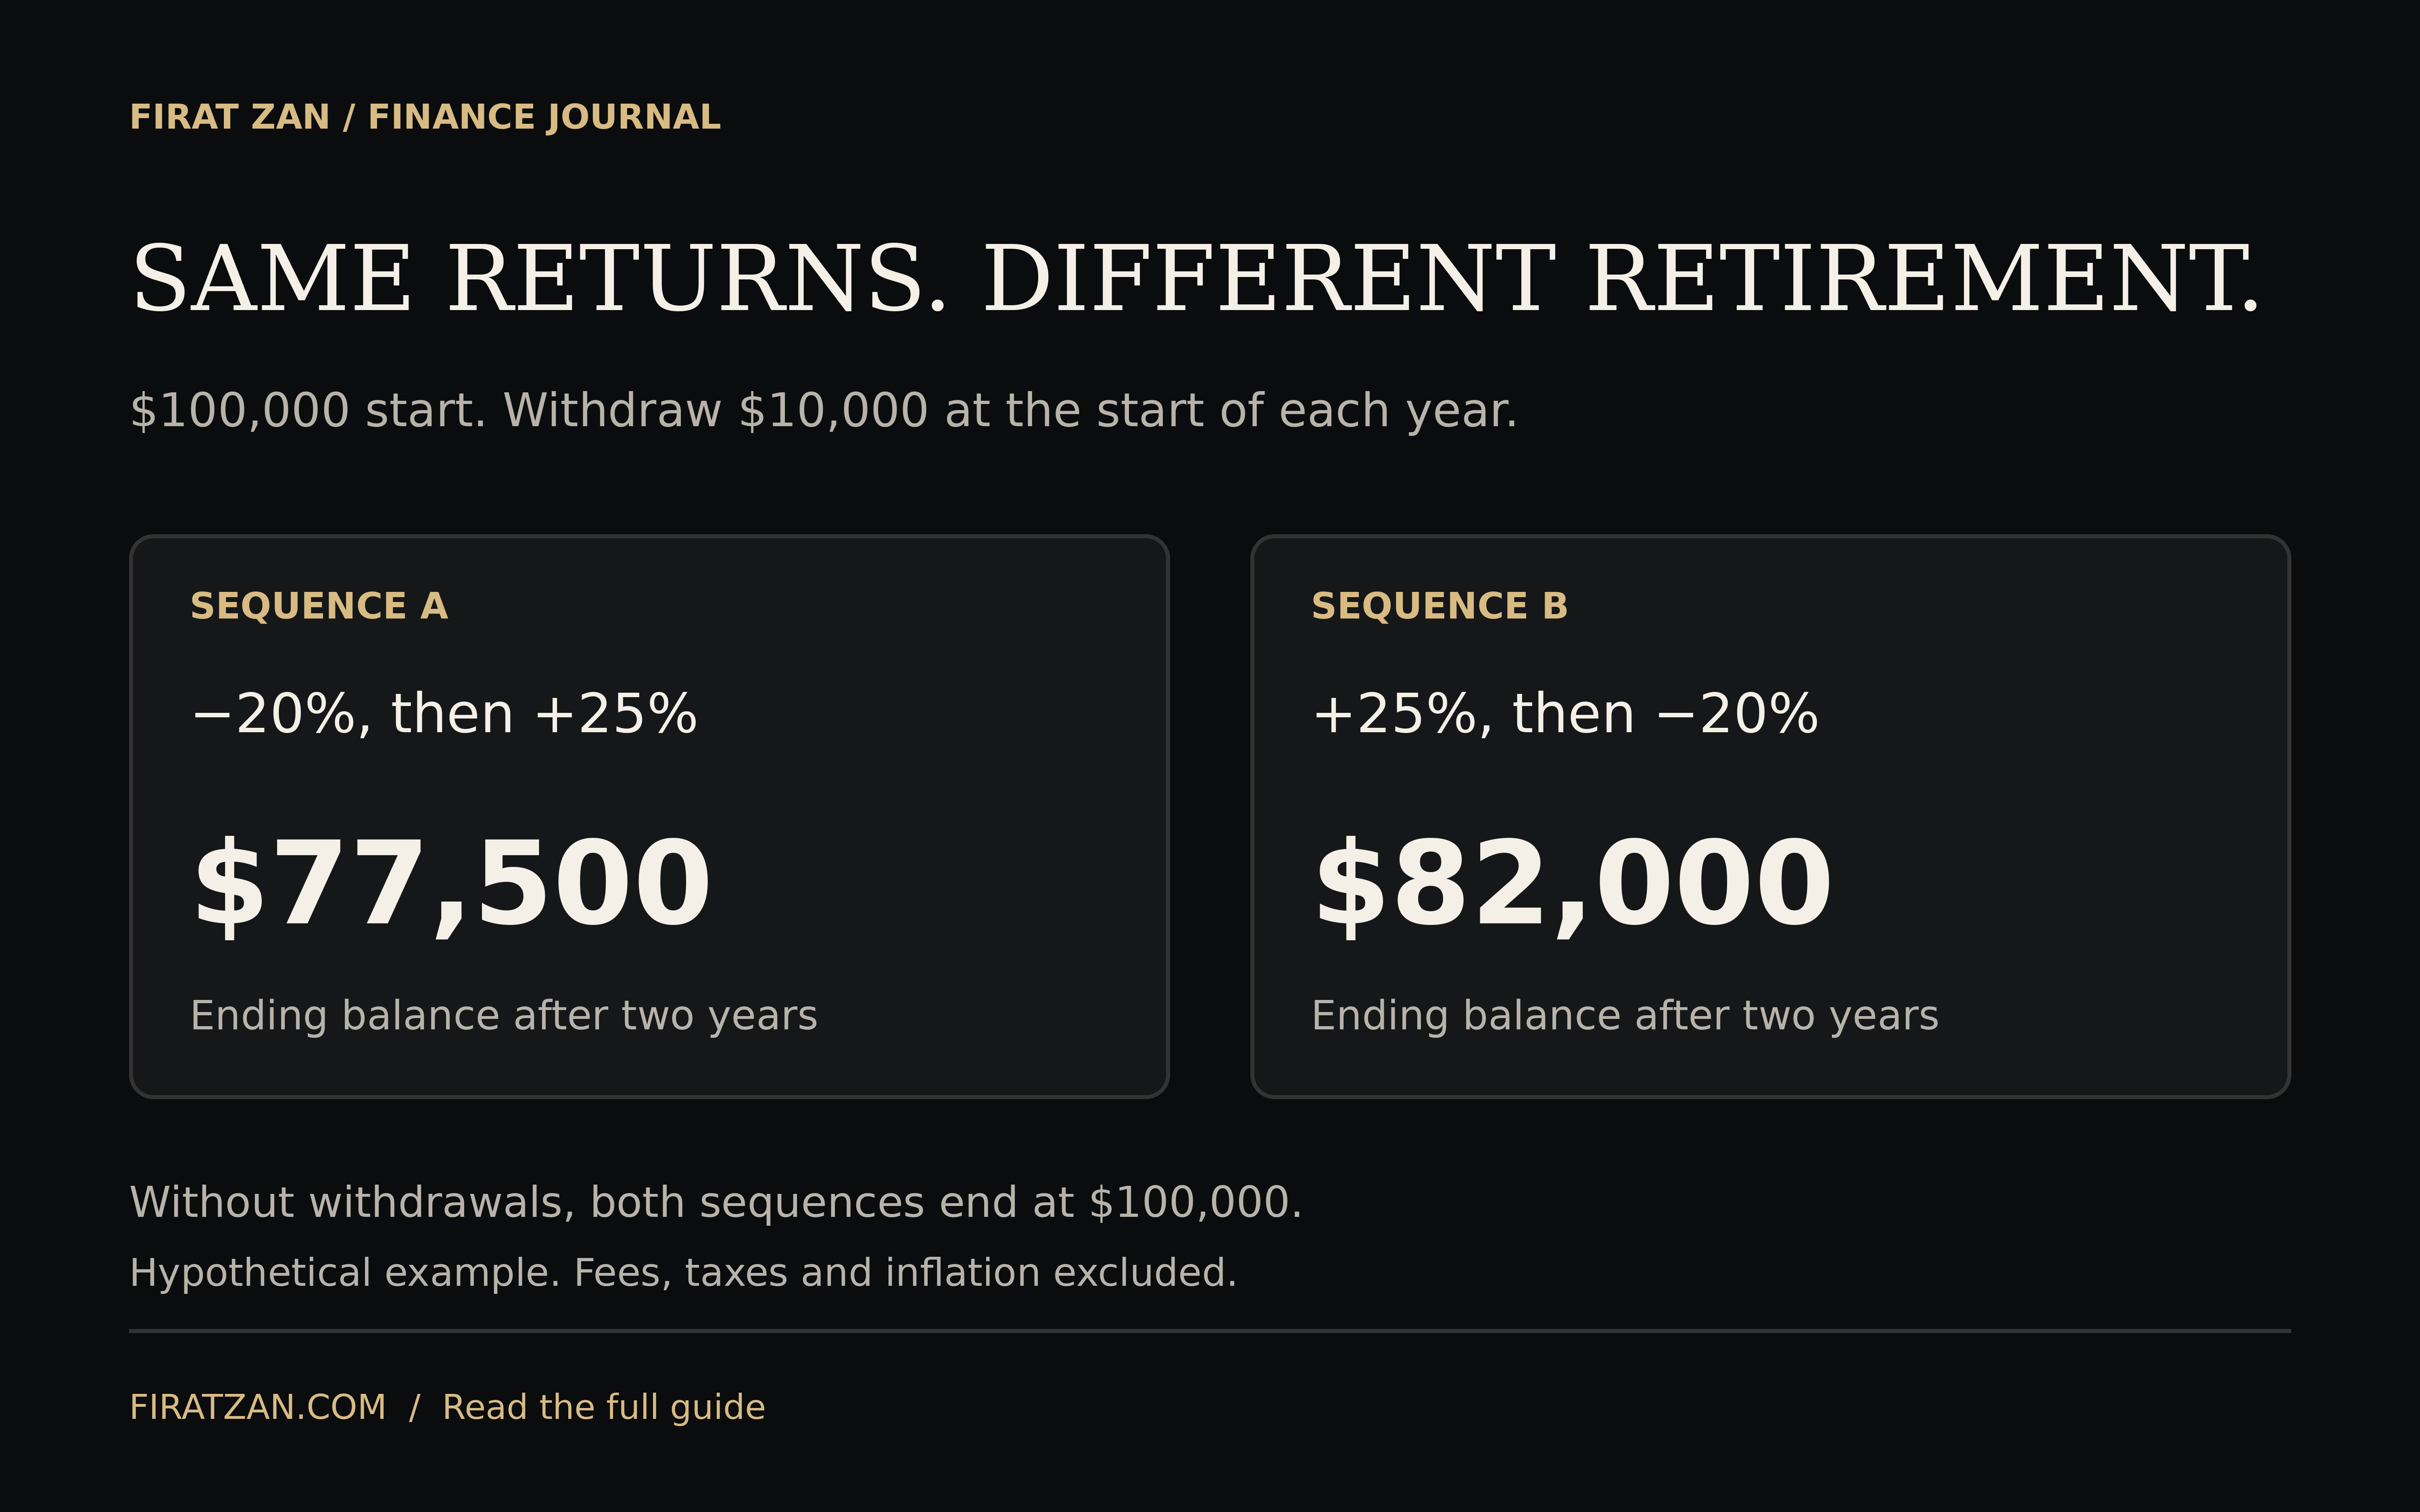
| Sequence | Year-one ending balance | Year-two ending balance |
|---|---|---|
| −20%, then +25% | $72,000 | $77,500 |
| +25%, then −20% | $112,500 | $82,000 |
Without withdrawals, either sequence would return the original $100,000 after two years because 0.80 multiplied by 1.25 equals one. With the stated withdrawals, the ending balances differ by $4,500. The illustration excludes taxes, fees and inflation, and its 10% withdrawals are chosen to make the mechanism clear rather than recommend a spending rate.
Planning responses can include flexible discretionary spending, diversified assets and money reserved for near-term commitments. None makes an investment portfolio immune to losses. What matters is whether a bad early period would force spending changes or asset sales that the plan cannot tolerate.
Investor.gov links asset allocation to time horizon and risk tolerance and describes diversification as spreading exposure across investments. A retirement portfolio should be examined as a whole, including any business interests and real estate outside the brokerage account.
7. Keep today's spending and future money consistent
A target expressed in today's purchasing power is not the same as a future nominal balance. If a current spending gap is $48,000 and prices rise at a hypothetical constant 3% annually for twenty years, the future nominal equivalent is approximately $86,693. Using today's spending beside a future inflated portfolio balance can make progress appear larger than it is.
One approach is to keep the entire plan in real terms: today's purchasing power, contributions held constant in real value and assumed returns after inflation. Another is to project nominal expenses, nominal contributions and nominal returns year by year. Either can work when applied consistently. Mixing the two is the problem.
The exact real return formula is the nominal growth factor divided by the inflation growth factor, minus one. At a hypothetical 6% nominal return and 3% inflation, the real return is about 2.91%, not exactly 3%. Over long periods, small inconsistencies in compounding can create material differences.
For a fuller treatment, see how inflation changes investment returns. The essential retirement-planning question is whether assets can fund future purchasing power, not whether the account displays a larger nominal number.
8. Savings rate controls an input you can actually change
The target is only one side of financial independence. The other is the process of building capital. Income, saving, starting assets, time and investment outcomes all affect progress. Of those inputs, monthly saving and spending are often more directly controllable than future market returns.
Consider a hypothetical starting portfolio of $50,000, twenty years of end-of-month contributions and a constant 5% effective annual real return. With $1,000 contributed monthly, the ending real balance is approximately $538,469. With $1,500, it is approximately $741,372. With $2,000, it is approximately $944,274.
These are mechanical projections, not forecasts. They assume the contribution retains the same purchasing power each month, use an equivalent monthly rate derived from 5% annually and exclude fees and taxes. Actual returns vary, and a nominal contribution held flat while prices rise would not follow the same real saving path.
The comparison reveals why improving surplus matters. A higher contribution changes the amount put to work without requiring a more optimistic return forecast. Increasing earnings, reducing recurring costs or preventing lifestyle spending from absorbing every pay rise can all change that contribution.
Reducing a recurring expense also changes the retirement target. A permanent $500 monthly reduction lowers the annual spending gap by $6,000. At a 4% illustrative assumption, that lowers the target by $150,000; at 3%, it lowers the target by $200,000. This arithmetic only applies if the spending reduction is sustainable and would otherwise have continued in retirement.
9. Build a planning range and test the weak points
Start with the central spending estimate, then create a higher-cost case. Add pressure on healthcare, housing, exchange rates or family support where relevant. Test a longer retirement horizon and a lower withdrawal assumption. The goal is to reveal which changes have the largest effect on the plan.
A person whose annual portfolio-funded gap is $48,000 might first examine the $1.2 million, $1.37 million and $1.6 million figures associated with 4%, 3.5% and 3%. The next step is to ask whether those targets include the right costs and whether the portfolio behind them supports the intended horizon. A range is more informative than pretending one figure is exact.
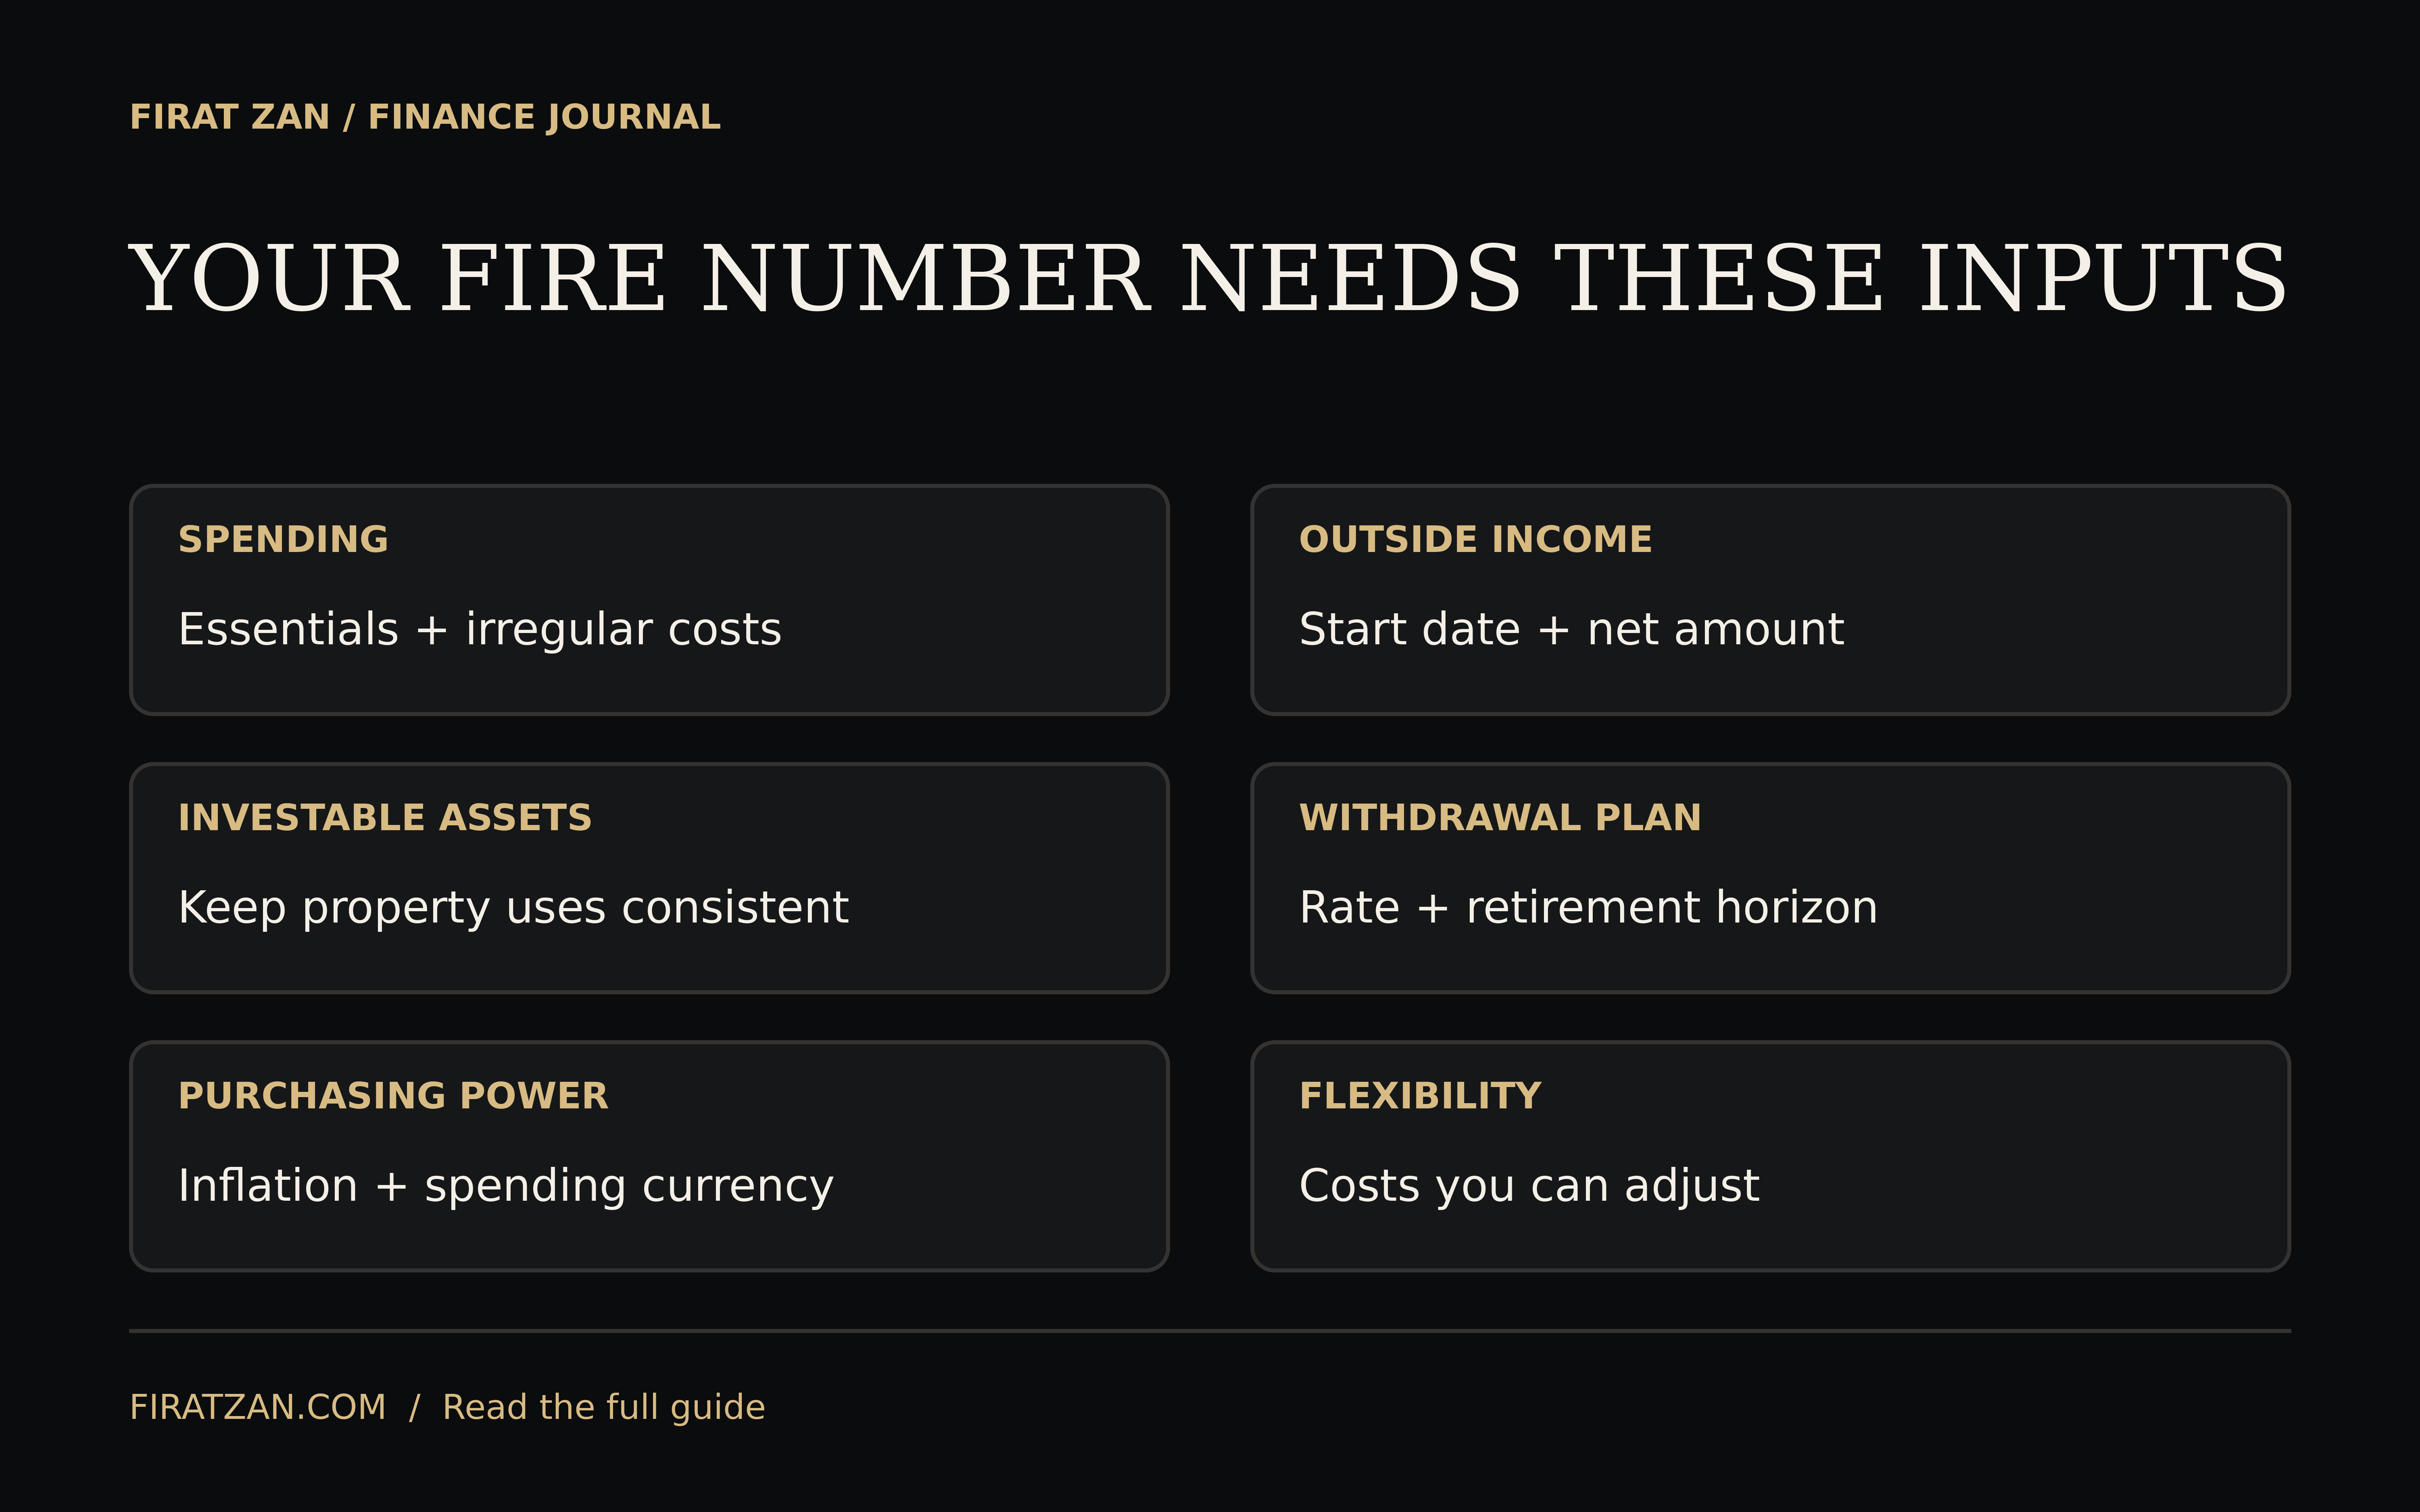
Financial independence can create choices before someone stops working entirely. Part-time income, a staged transition or a later pension start can change the required portfolio path. Model those decisions explicitly rather than declaring that one static target solves every future stage.
The practical aim is a balance sheet that can support a desired life through different conditions. A target helps organize that work, but income timing, liquidity and spending flexibility determine how the plan behaves when reality differs from the projection.
Frequently asked questions
How much money do I need to retire on $3,000 a month?
If the full $36,000 annual amount must come from the portfolio, the illustrative target is $900,000 at 4%, about $1.03 million at 3.5% and $1.2 million at 3%. Additional costs, taxes, outside income and the retirement horizon can change those figures.
Is $1 million enough to retire?
It depends on spending and dependable outside income. A 4% first-year assumption corresponds to $40,000 of withdrawals from $1 million, before any adjustment the plan requires. The rate's sustainability depends on the portfolio, horizon, costs and withdrawal policy.
What is the FIRE number?
It is an estimate of the investment capital needed to support financial independence. A common starting calculation divides annual portfolio-funded spending by an assumed initial withdrawal rate. The estimate needs a realistic budget and should be tested under different assumptions.
Should my home be included in my FIRE number?
A home you keep living in should not automatically be counted as capital available for portfolio withdrawals. Include sale proceeds or other funding actions only if they are part of the actual plan. Avoid counting both an asset's value and an incompatible ongoing use of that same asset.
Does the 4% rule work for early retirement?
It should not be adopted without reviewing the longer horizon. A retirement lasting forty or fifty years is a different planning problem from a thirty-year model. Spending flexibility, portfolio composition and other income need to be evaluated alongside the starting rate.
All tables and numerical examples are hypothetical calculations prepared for this guide. Rounded values can differ slightly from unrounded calculations. Withdrawal-rate comparisons are sensitivity illustrations, not guarantees or a recommended asset allocation. Educational analysis by Firat Zan.
Concept references: Morningstar: The State of Retirement Income, 2025; Investor.gov: asset allocation and diversification; Investor.gov: investment fees; Investor.gov: managing lifetime income.