Investment Drawdowns and Recovery: Why a 20% Loss Needs a 25% Gain — Firat Zan
A loss and an equal percentage gain do not cancel out. Firat Zan explains drawdown recovery, compounding, cash withdrawals and leverage through practical, clearly labeled investment examples.

An investment falls by 20% and later rises by 20%. It sounds as though the two moves should cancel each other out. They do not. A $100,000 balance becomes $80,000 after the decline, and a 20% increase on that smaller amount brings it to $96,000. The investment remains $4,000 below where it started.
This simple asymmetry explains why the size of a drawdown matters. Percentage losses are measured against the earlier balance; subsequent gains are measured against the reduced balance. As the loss becomes larger, the gain required to recover becomes disproportionately larger. The arithmetic is straightforward, but its implications are easy to miss when investments are discussed only in annual return percentages.
This guide examines recovery as an investment measurement problem. It covers the difference between an account balance and investment performance, the impact of cash flows, the relationship between volatility and compounding, and the way borrowing changes equity losses. Every numerical path is an original hypothetical example, rather than a forecast, trading signal or description of a particular market.
1. Define the peak before measuring the decline
A drawdown describes a decline from an earlier peak in the value series being examined. If a hypothetical portfolio rises from $100,000 to $120,000 and then falls to $90,000, its drawdown from that peak is 25%. Relative to its original starting balance, it is down 10%. Both statements can be correct because they use different reference points.
The definition of the value series matters too. A price chart may exclude dividends. A total-return series generally incorporates distributions according to its methodology. An account balance can change because an investor adds or removes money. Before comparing drawdowns, make sure the series use consistent treatment of income, fees and external cash flows.
Maximum drawdown is the deepest peak-to-trough decline observed within a specified measurement period and frequency. It is a historical observation, not a ceiling on future losses. A monthly series can miss a sharp fall and recovery that occurred between month-end dates. Record the observation window and data frequency rather than report an impressive number without context.
2. Use the recovery formula
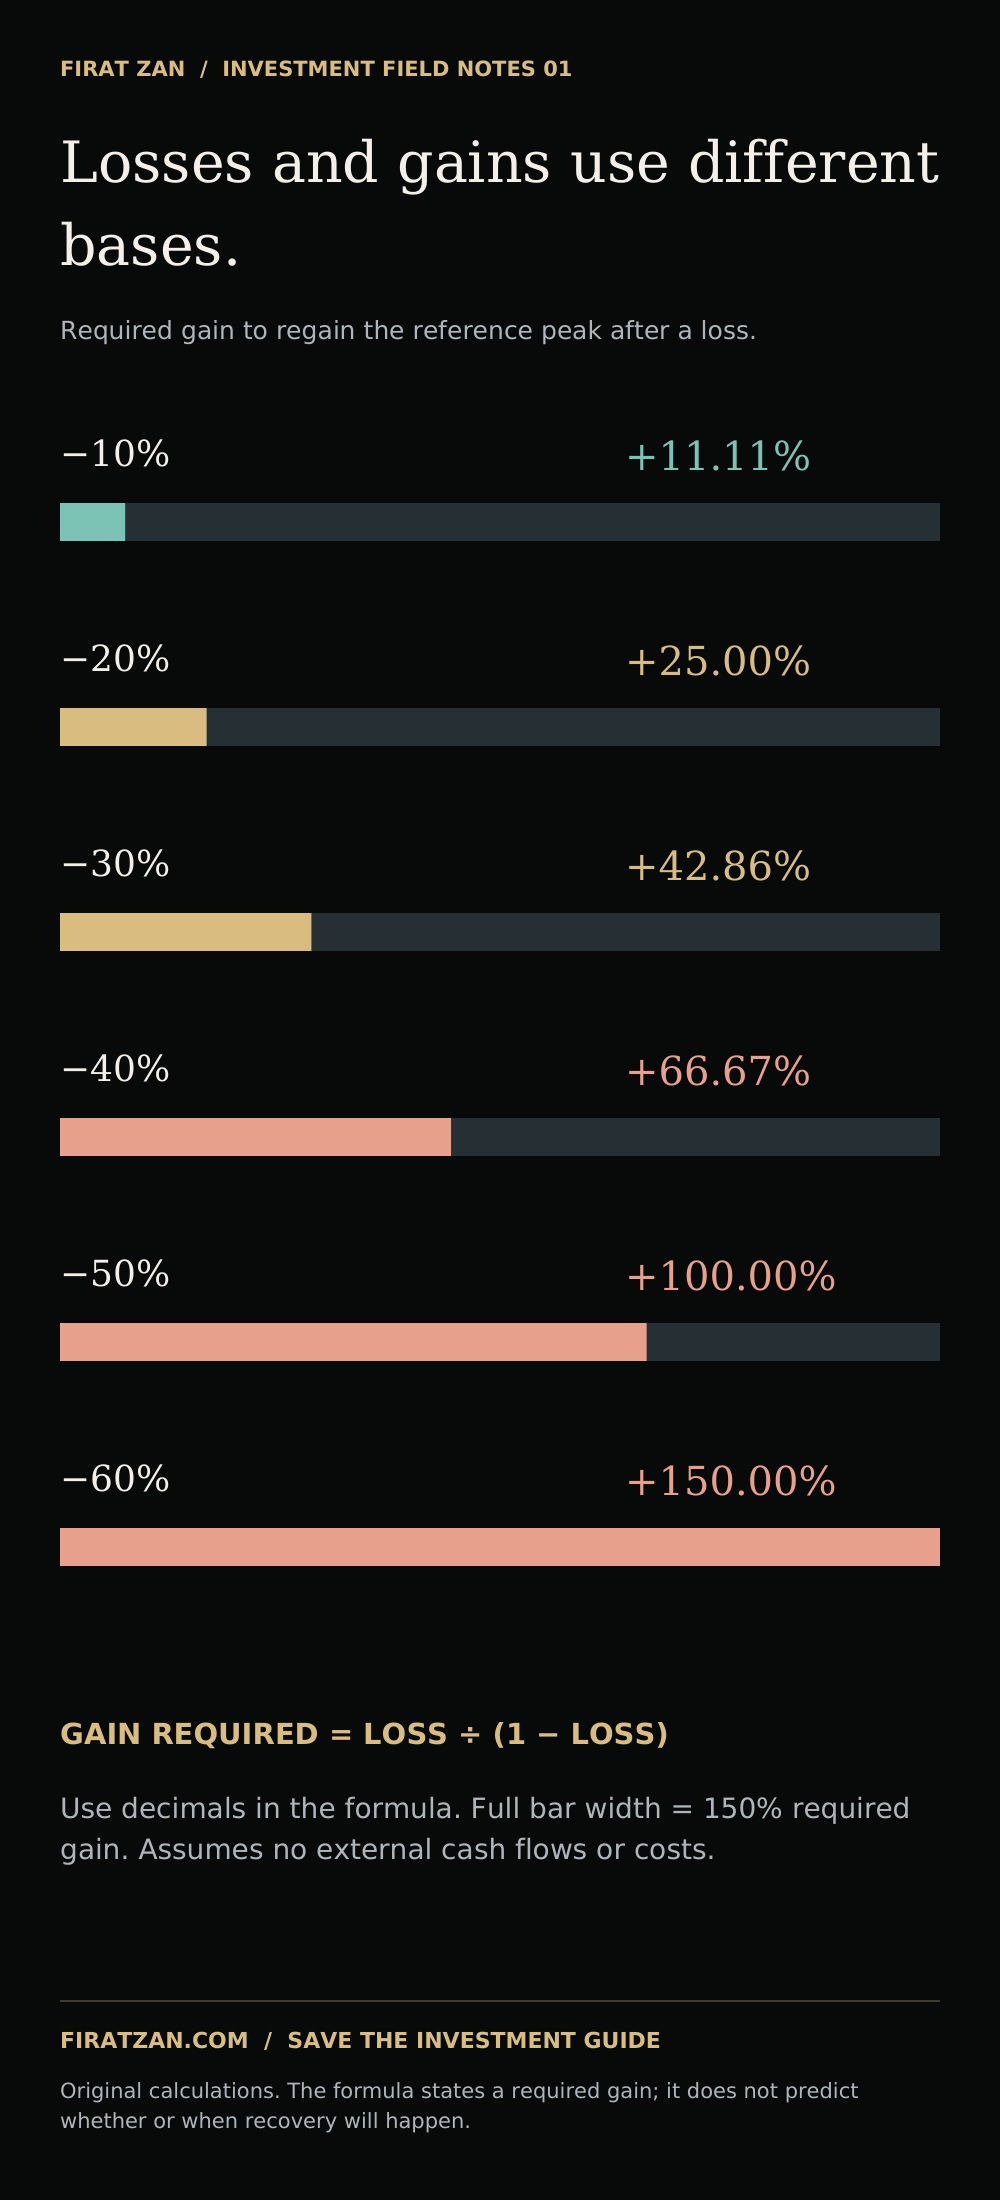
Let the loss be L as a decimal, measured from the reference peak. After the decline, one dollar of capital becomes one minus L dollars. The gain required to return to the peak is L divided by one minus L. Equivalently, divide one by one minus L, then subtract one. The formula assumes no contributions, withdrawals, fees or distributions outside the measured value.
For a 20% loss, the remaining balance is 80% of the starting value. Recovering the missing 20% requires a 25% gain on that remaining 80%: 0.20 divided by 0.80. A $100,000 investment reduced to $80,000 therefore needs to earn $20,000, and $20,000 is one-quarter of $80,000.
The calculation changes the reference base; it does not reveal how likely recovery is. An investment might recover quickly, take many years or never return to its old peak. The required percentage is a useful description of the challenge, but it is not evidence that a rebound is due or that a particular asset must eventually recover.
3. Compare shallow and deep drawdowns
A 10% loss requires approximately an 11.11% subsequent gain to recover. A 20% loss requires 25%. A 30% loss requires about 42.86%, a 40% loss requires about 66.67%, and a 50% loss requires 100%. At a 60% loss, the recovery requirement reaches 150%. These values come directly from the same formula and share the same no-cash-flow assumptions.
The pattern explains why doubling down on risk simply to get back to an old balance can create a difficult trade-off. A larger upside target usually does not arrive without additional uncertainty or a longer horizon. The previous peak is a measurement reference; it is not an instruction to select the riskiest available route back to that number.
Risk assessment should happen before the decline as well as after it. Ask what an adverse scenario would do to the whole portfolio, whether existing obligations would still be funded and which holdings might fall together. The recovery table helps translate a loss assumption into a second, more informative number: the gain that would then be needed.
4. An average return is not the compounded return
Consider a two-year investment with a 20% gain followed by a 20% loss. A $100,000 starting balance rises to $120,000, then falls to $96,000. The arithmetic average of the two annual returns is zero, but the cumulative return is negative 4%. Reversing the order produces the same ending value when there are no external cash flows.
The annualized compounded return over those two years is the square root of 0.96 minus one, approximately negative 2.02%. This is the constant annual rate that would reproduce the same beginning and ending balances. It answers a different question from the arithmetic average, which describes the average of the individual annual percentages.
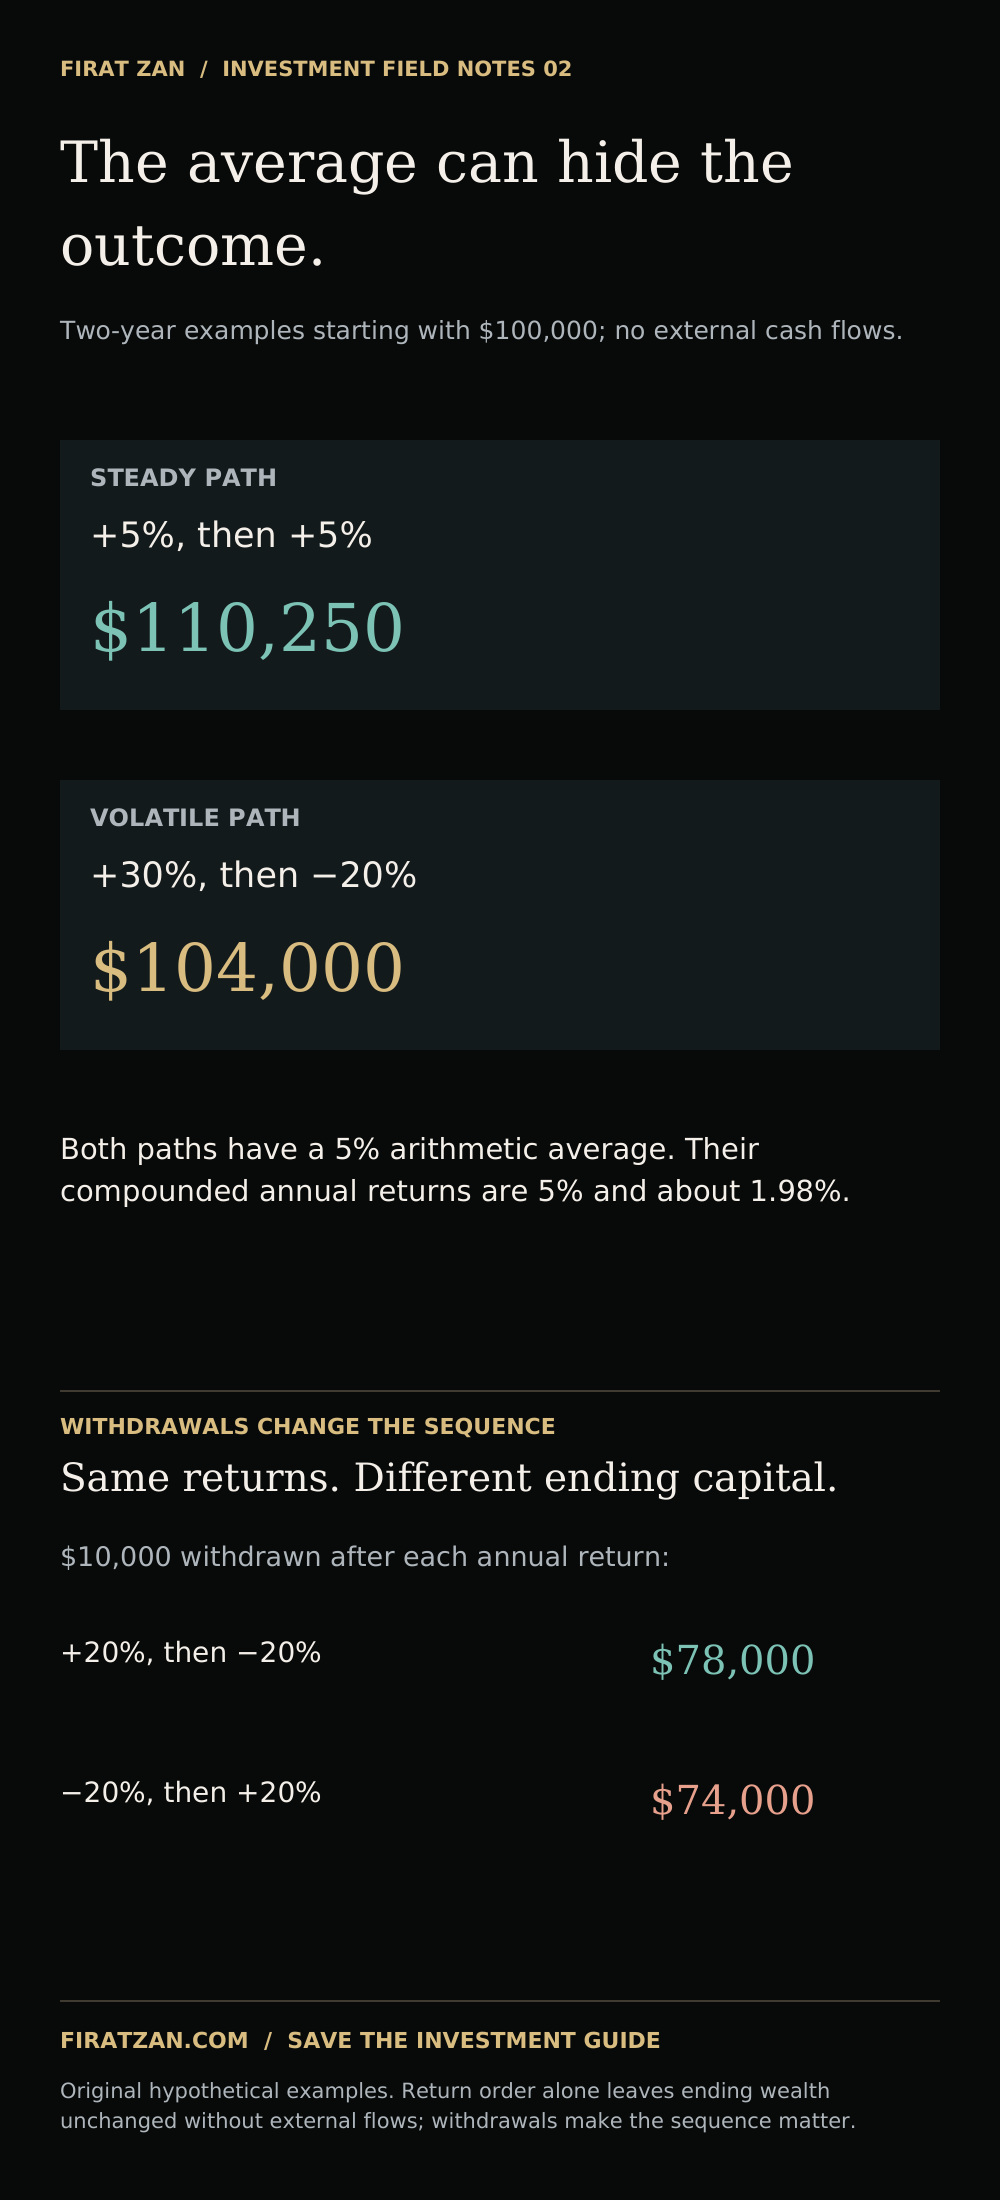
Another invented comparison makes the distinction clear. A steady 5% return in each of two years turns $100,000 into $110,250. A 30% gain followed by a 20% loss has the same arithmetic average of 5%, but ends at $104,000. Their compounded annual returns are 5% and approximately 1.98%, respectively. Equal arithmetic averages do not imply equal wealth outcomes.
5. Sequence matters when money leaves the portfolio
Use the earlier 20% gain and 20% loss, but now withdraw $10,000 at the end of each year. If the positive year comes first, $100,000 becomes $120,000, then $110,000 after the first withdrawal. The following 20% decline leaves $88,000, and the second withdrawal leaves $78,000. Total withdrawals are $20,000.
Reverse the returns. The first 20% decline leaves $80,000, then $70,000 after the withdrawal. A subsequent 20% gain raises that balance to $84,000, and the second withdrawal leaves $74,000. The same annual returns and the same total withdrawals have produced a $4,000 difference in ending capital because cash left the two paths at different valuations.
This example is relevant whenever an investment portfolio funds external commitments, including a business payment or another acquisition. It does not require a retirement scenario. The practical issue is whether capital must be removed after a decline, leaving fewer invested units to participate in a later gain. Contribution timing can also change investor outcomes, so record every external cash flow and its date.
6. Adding money can repair a balance without repairing performance
Suppose a $100,000 investment falls to $80,000 and its owner contributes another $20,000. The account once again displays $100,000, but the investment has not earned its way back to the original balance. The owner has supplied additional capital. Calling this a full investment recovery would confuse a funding decision with an investment result.
Account-level performance measures address this problem in different ways. Time-weighted return seeks to separate investment performance from the size and timing of external contributions and withdrawals. Money-weighted return reflects those cash-flow timings. Neither should be replaced by a simple comparison of the account's current balance with its original opening balance when external flows are material.
Keep the investment's recovery and the investor's funding requirement in separate columns. A new contribution might be sensible for reasons unrelated to the old purchase price, but it still uses resources that could have served another purpose. The evidence for a new allocation should be the current investment case rather than a desire to make a statement balance look recovered.
7. Estimate recovery time without pretending to forecast it
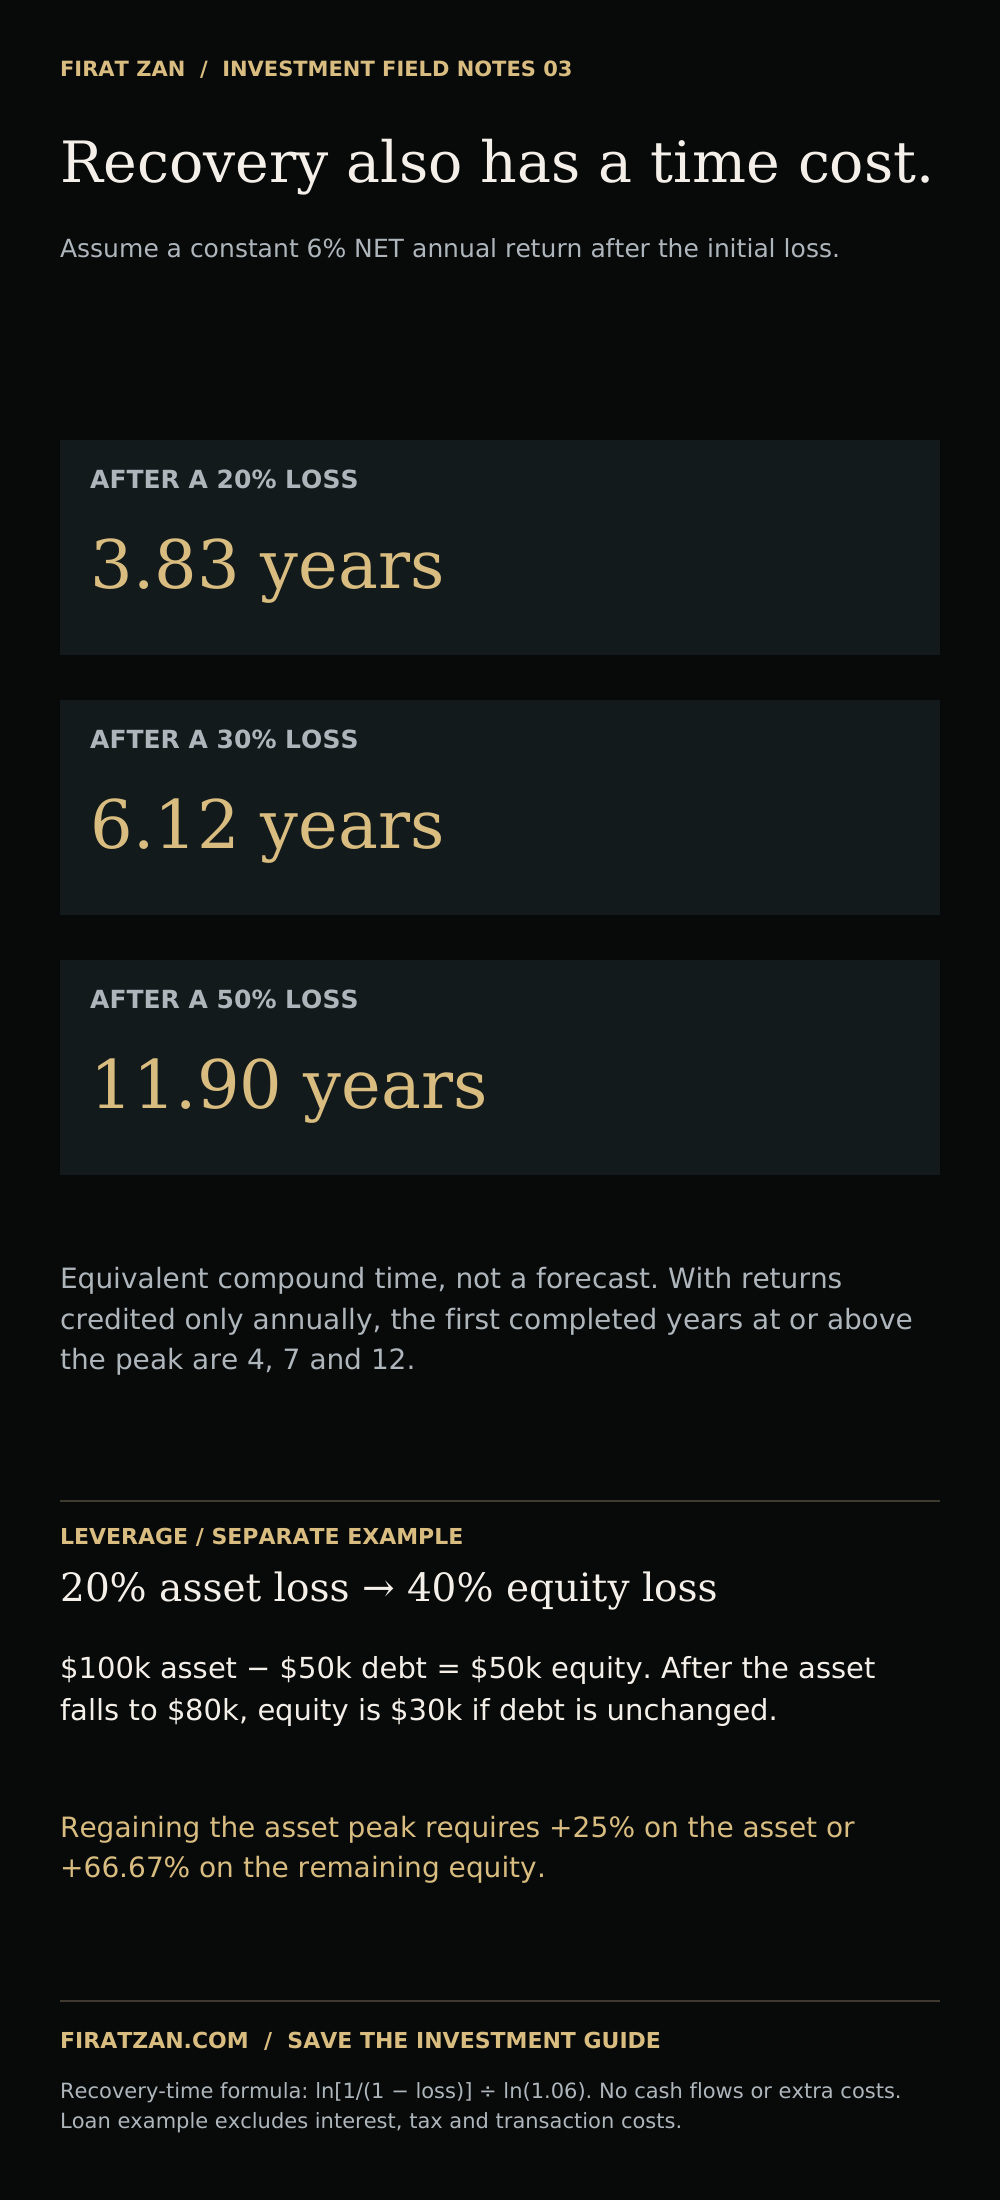
A required gain is not a required number of months. To illustrate time, assume an investment earns a constant 6% net annual return after a drawdown, with no new money or withdrawals. Divide the logarithm of the required recovery factor by the logarithm of 1.06 to calculate the equivalent number of years. This deliberately smooth return path is a mathematical assumption.
Under that assumption, recovery from a 20% loss takes approximately 3.83 years. Recovery from a 30% loss takes about 6.12 years, and recovery from a 50% loss takes about 11.90 years. If returns are credited only once at year-end, the first completed annual observations at or above the original peak would occur after four, seven and twelve years, respectively.
Actual returns fluctuate, and a negative year during the recovery changes the path. Fees, withdrawals and taxes may extend the time needed to restore spendable capital. The point of the illustration is to connect loss depth with capital required and time under an explicit assumption. It does not establish a deadline or an expected market recovery schedule.
8. Leverage changes the owner's recovery challenge
In a separate example, an asset worth $100,000 is financed with $50,000 of debt and $50,000 of owner equity. If the asset falls by 20% to $80,000 and the debt is unchanged, equity becomes $30,000. The owner's equity has declined 40%, even though the asset itself declined 20%. Ignore interest, taxes and transaction costs for this illustration.
Returning the asset from $80,000 to $100,000 requires a 25% asset gain. Over the same move, equity rises from $30,000 to $50,000, which is a 66.67% equity gain. The two recovery percentages are different because they refer to different capital bases. This is another reason to state whether a return is measured on gross assets or investor equity.
Loan terms determine whether declining collateral values create a margin call, another funding obligation or no immediate contractual event. Scheduled interest and principal payments still require funding according to the contract. An intention to wait for a rebound does not itself create the cash needed to support a financed position during a prolonged decline.
9. Compare nominal recovery with purchasing-power recovery
A portfolio can regain its previous dollar balance without regaining its previous purchasing power. Suppose a $100,000 peak is reached again three years later while prices rise by an assumed 3% each year. Preserving the earlier purchasing power would require approximately $109,273, calculated as $100,000 multiplied by 1.03 cubed. This is a separate hypothetical inflation illustration.
Currency adds another reference point for international investors. A local-currency asset price may regain its old peak while the currency is worth less in the investor's reporting currency. Use a consistent reporting currency for a comparison, and retain the local result separately so that asset performance and exchange-rate effects can be understood rather than blended together.
Income distributions and costs matter as well. An asset's market price may remain below its peak while reinvested income improves total return. Conversely, an apparent price recovery may leave the investor below break-even after buying, financing or selling costs. Define what has recovered: price, total return, account value, equity or real spendable wealth.
10. Review the investment case after a loss
A useful post-loss review begins with facts: the current value, the reference peak, total external contributions and withdrawals, debts attached to the investment and the updated evidence supporting future cash flows. Separate a fall in quoted market price from permanent damage to an asset's earning capacity. The distinction requires analysis; the percentage decline alone cannot resolve it.
Then compare the holding with its realistic alternatives, including transaction costs and tax effects where relevant. Keeping an investment is a new allocation decision at today's value. Selling it is also a decision with consequences. Neither should be justified solely by the original purchase price or by the hope that a particular percentage rebound must follow a decline.
Drawdown arithmetic is most useful when it improves capital decisions before pressure builds. Understand the loss a portfolio could face, the gain that would then be required and the cash obligations that might arrive along the way. A clear recovery framework connects risk to the investor's actual ability to remain invested rather than reducing the decision to a single attractive upside number.
Frequently asked questions
Why does a 20% loss need a 25% gain?
The decline takes $100,000 to $80,000. Recovering $20,000 from an $80,000 base requires a 25% gain, assuming no other cash flows or costs.
Do equal positive and negative returns cancel out?
No. A 20% rise and 20% decline produce a cumulative 4% loss without external cash flows, in either order.
Does adding capital mean an investment has recovered?
It can restore the account balance, but the added money is an external contribution rather than investment return.
Can the recovery formula predict a rebound?
No. It states the gain required to regain a reference value. It cannot establish whether, when or how a particular investment will recover.
Educational investment commentary. All numerical examples are hypothetical, with assumptions stated in the text and graphics. They are not market forecasts or individual investment recommendations.
Continue reading
Investment Fees and Compounding: The Long-Term Cost Investors Miss — Firat Zan
Portfolio Concentration Risk — Firat Zan