Investment Fees and Compounding: The Long-Term Cost Investors Miss — Firat Zan
Small investment fees can create a large gap in long-term wealth. Firat Zan explains annual charges, layered costs and the difference between fees paid and growth forgone through clear, hypothetical examples.

A one-percent annual charge looks modest beside the movement of a stock market or the advertised return on an investment. It can feel like a minor administrative detail. Yet an ongoing fee changes the amount of capital that remains invested after every charging period, and that smaller balance becomes the starting point for the next period's return.
This is why investment fees deserve a place in the investment case before money is committed. The relevant question is broader than the amount deducted this year. It includes the future growth that deducted capital can no longer earn, the timing of charges and the services purchased in exchange. A cost is not automatically unreasonable, but it should be visible and understood.
This guide uses original numerical examples to show how fee structures work. It does not compare specific funds, endorse a provider or forecast market returns. All rates, balances and charges below are hypothetical. The aim is to make two opportunities comparable by placing their costs on the same timeline and using the same definition of return.
1. Separate the investment return from the charging method
Begin with the amount invested, the period measured and whether the quoted return is before or after each charge. A product performance figure may already include its internal operating expenses while excluding an external advisory fee. A brokerage account statement may report another measure. Subtracting an expense twice is as misleading as ignoring it entirely.
The SEC's investor education guidance explains that investment fees reduce the capital available to earn returns. For funds, it distinguishes operating expenses from charges applied to an investor's transactions or account. Those broad categories are useful, but the actual documents determine the fee base, collection dates and what a reported performance number includes.
Create a short cost inventory before calculating anything. Record the name of each charge, who receives it, the balance or transaction on which it is calculated and whether the performance figure already reflects it. A label such as management fee or service charge is only the beginning of the analysis. The charging rule is what makes the number usable.
2. Use an explicit model for annual fees
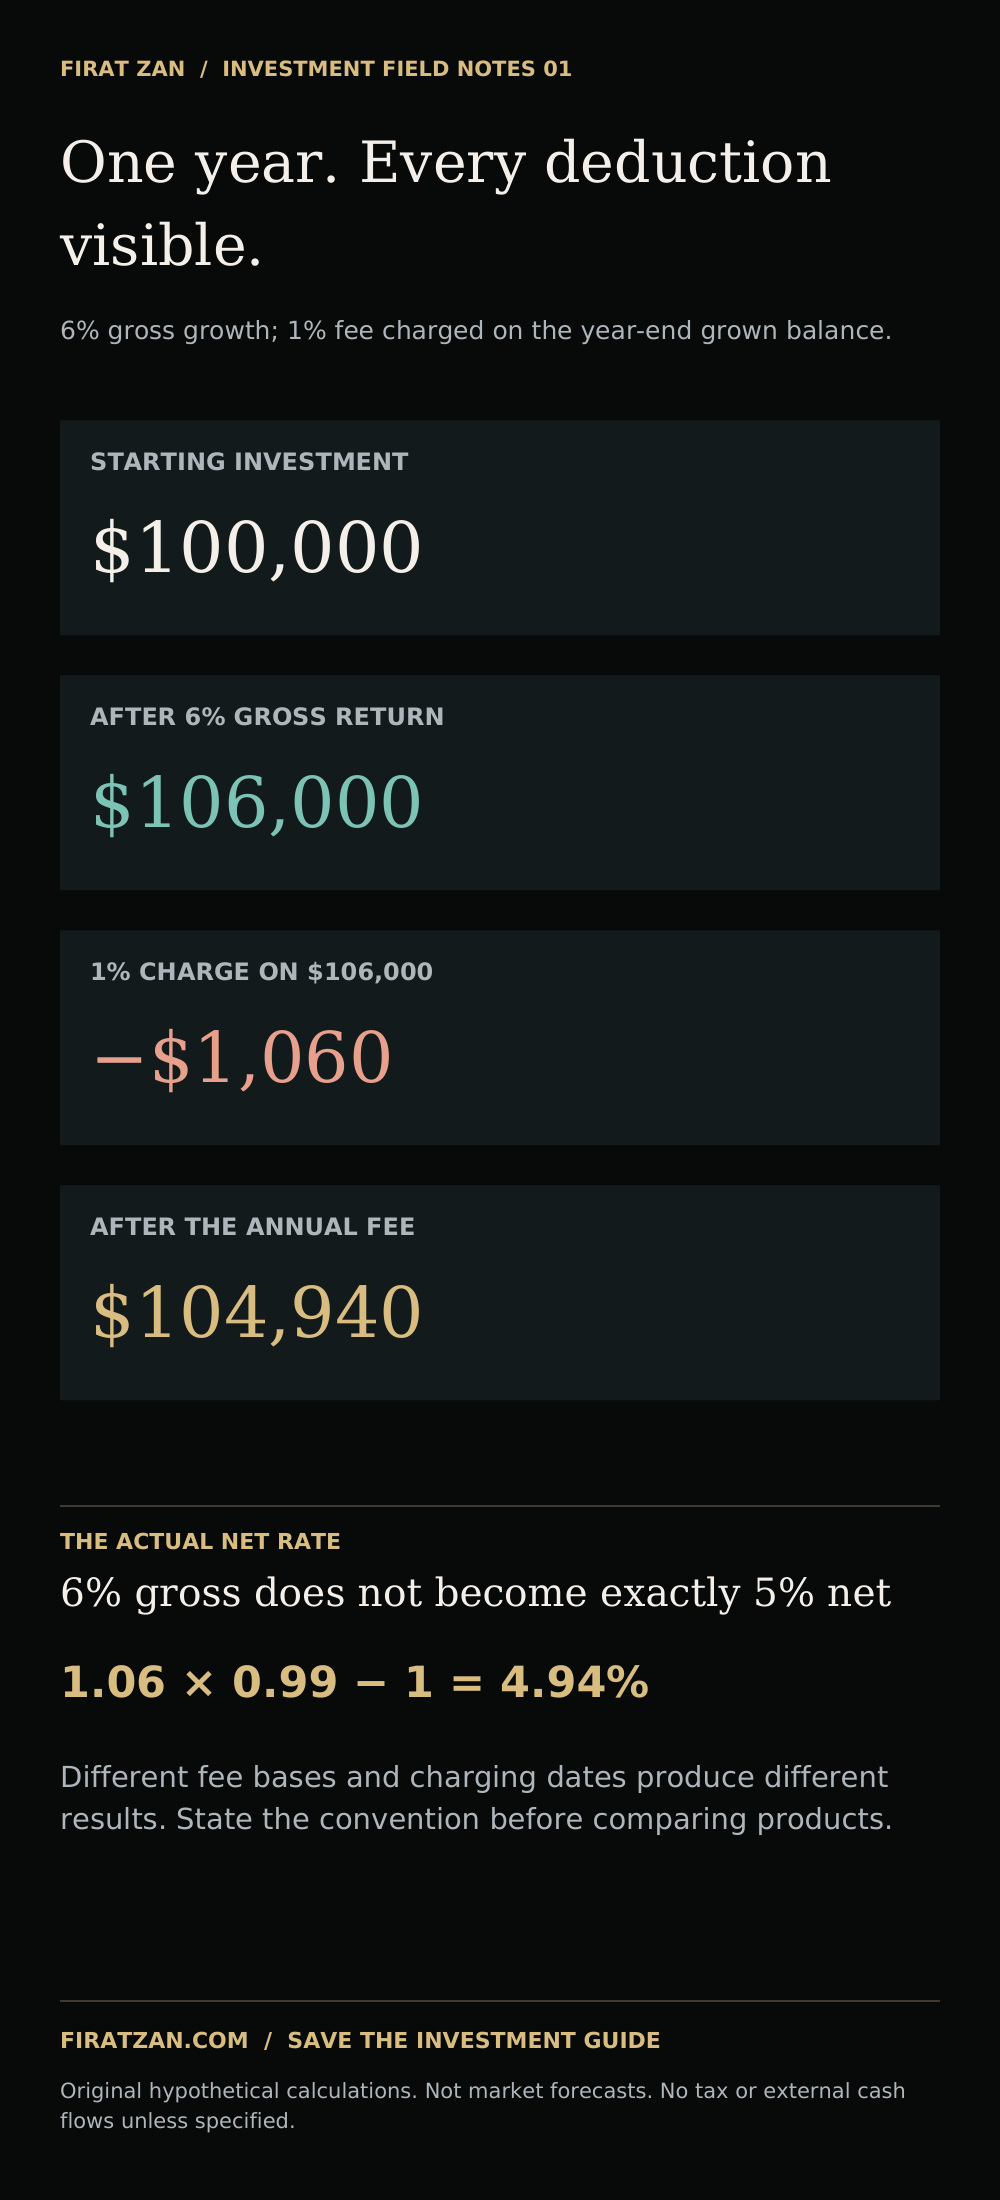
Assume an initial $100,000 investment earns a hypothetical 6% gross return during a year. Suppose a 1% fee is then charged on the balance after that return. The balance first reaches $106,000. The charge is $1,060, leaving $104,940. Under this specific convention, the investor's net annual return is 4.94%, rather than exactly 5%.
The annual growth factor is 1.06 multiplied by 0.99, which equals 1.0494. Repeating the same return and charging convention for twenty years gives $100,000 multiplied by 1.0494 to the twentieth power. A fee charged on the opening balance, an average daily balance or at several dates produces a different calculation. The convention is part of the assumption.
A quick estimate that subtracts a fee rate from a gross return may be adequate for an initial comparison, but an exact illustration should specify the sequence. Do not treat the formula used here as the accounting method for every investment product. Replace it with the actual contractual method before estimating an actual investor outcome.
3. See how a small annual difference compounds
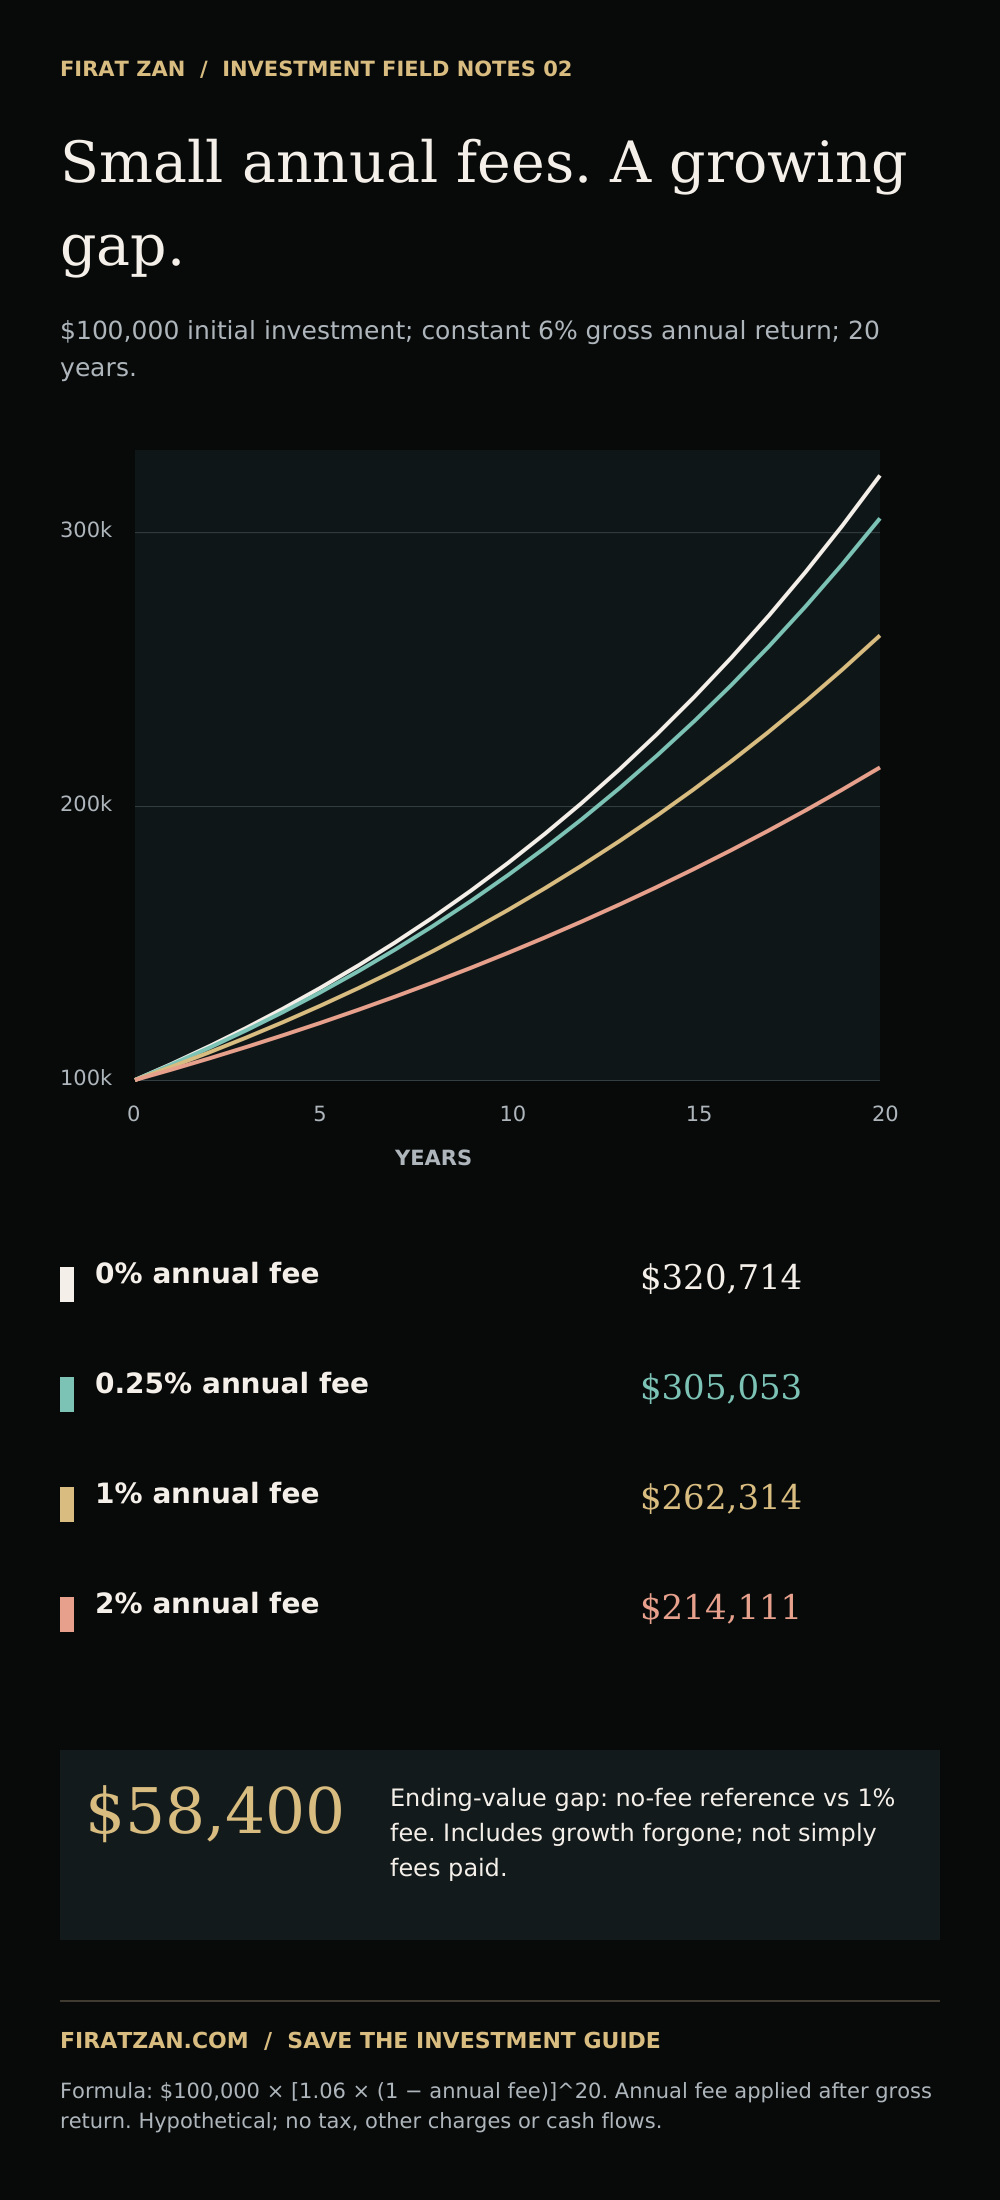
Keep the same $100,000 starting balance and constant 6% gross annual return for twenty years. Assume no new contributions, withdrawals, taxes or other costs. With no annual fee, the modeled ending balance is approximately $320,714. This is a mathematical reference case, not an assertion that a comparable cost-free product exists.
An annual fee of 0.25%, charged after each year's gross return, produces approximately $305,053. At 1%, the modeled ending balance is $262,314. At 2%, it is $214,111. These are results of the stated formula, rounded to the nearest dollar, and they should not be interpreted as expected returns or actual product performance.
The gap between the no-fee reference and the 1% case is approximately $58,400. That difference is about 18.21% of the reference ending balance. It is not a statement that 18.21% was charged as a fee. The gap combines deductions with the returns those deducted amounts would otherwise have earned inside the model.
4. Distinguish fees paid from growth forgone
A useful annual ledger has an opening balance, gross investment gain, fee amount and closing balance. Adding the fee column shows the dollars directly deducted during the modeled period. Comparing the ending balance with a matched reference case answers a different question: how much smaller the account became after both deductions and their compounding effects.
For example, the first year's $1,060 charge in the 1% case is no longer invested in subsequent years. In the reference case, that same capital remains available to participate in the assumed returns. Later fees create further differences. This is why multiplying the starting balance by the annual percentage and number of years does not describe the full ending-value gap.
Keep the counterfactual consistent. Both paths should start with the same money, experience the same gross returns and use the same contribution and withdrawal schedule. Otherwise a difference attributed to fees may partly come from a different market exposure or cash-flow pattern. The comparison should isolate the question it claims to answer.
5. Compare the full stack of costs
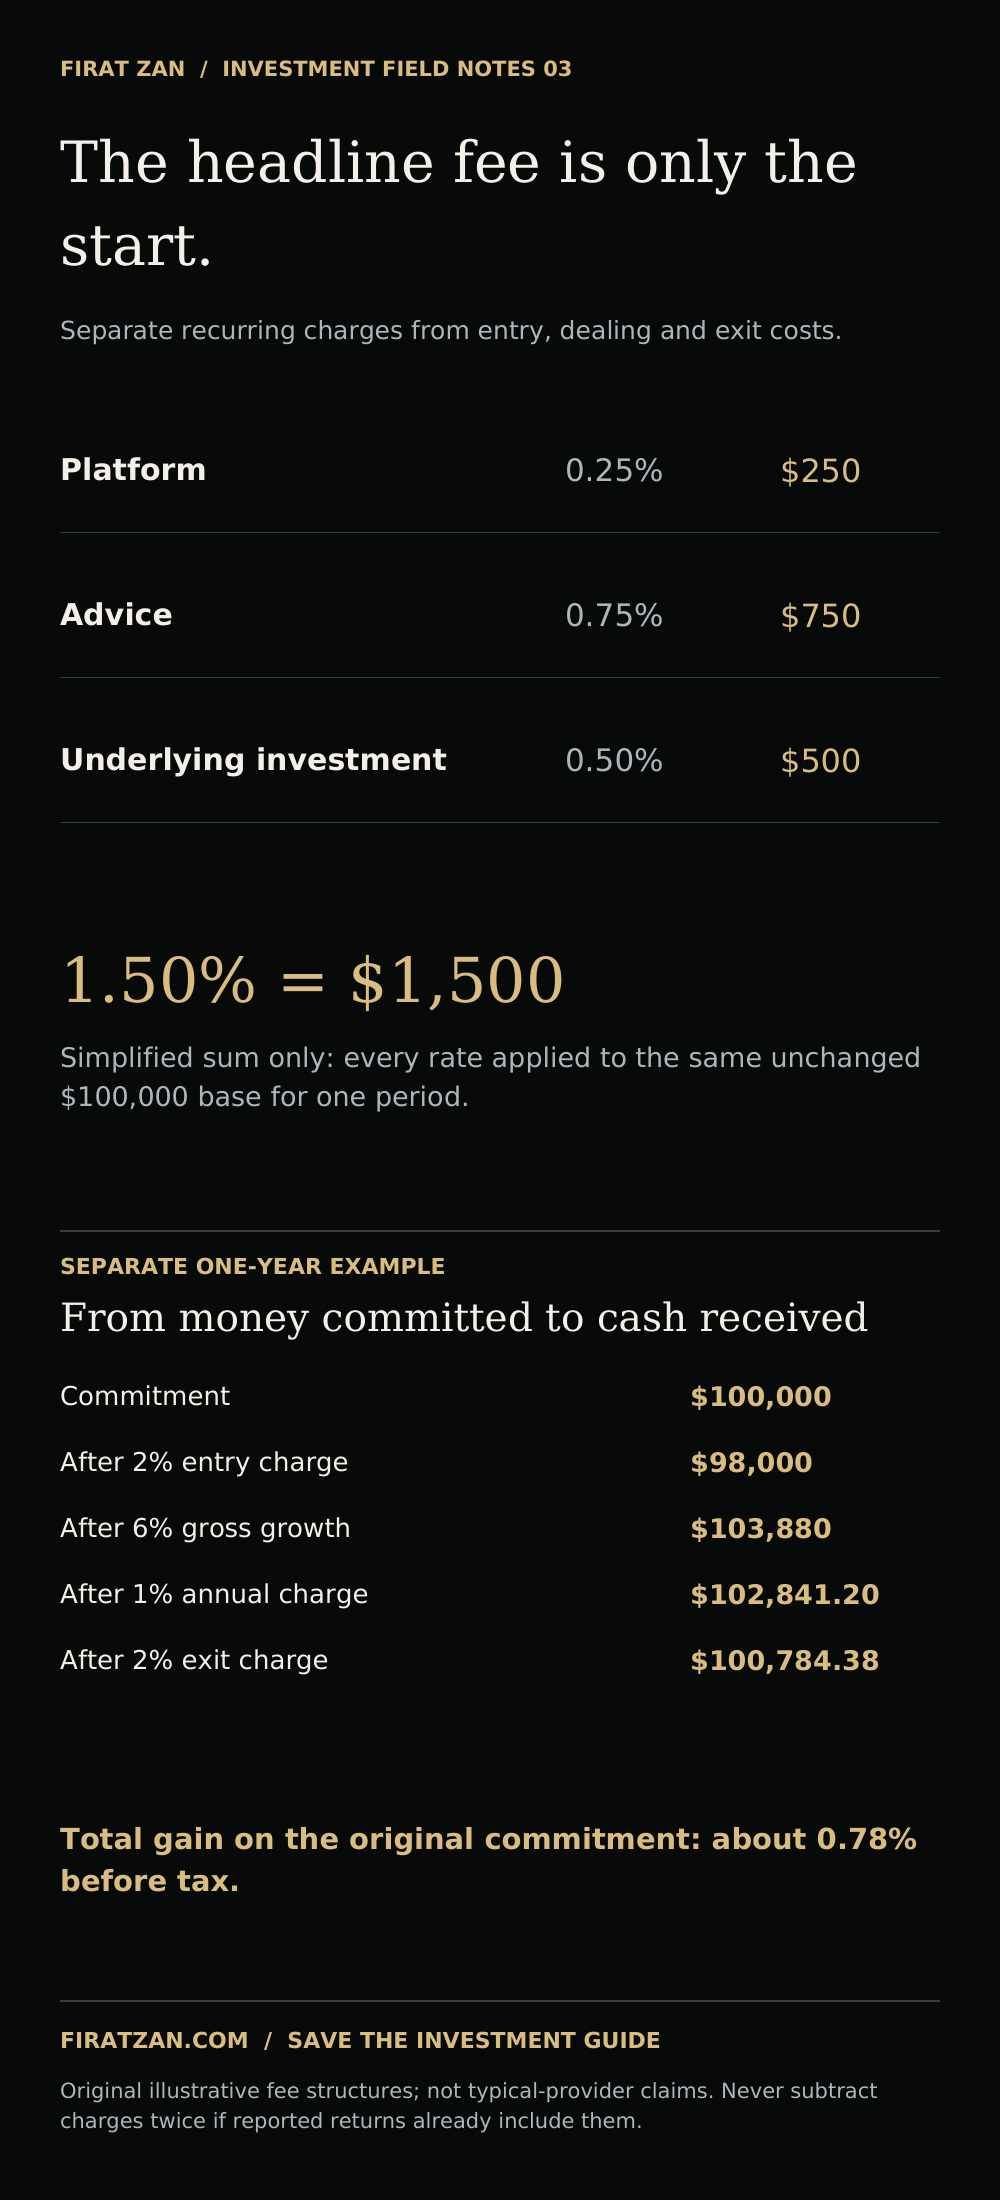
Consider a separate example with a $100,000 opening balance. Assume a platform charges 0.25%, an adviser charges 0.75% and the underlying investment charges 0.50%. If all three apply to that same unchanged opening balance for the same period, the simplified combined charge is 1.50%, or $1,500. This arithmetic does not establish how any real arrangement bills its investors.
The sum becomes less straightforward when one charge is already embedded in a quoted net return, when fee bases differ or when minimum charges apply. Ask whether an advisory service includes custody, dealing or some fund expenses. If it does, adding separate estimates for those services may overstate the cost. If it does not, the quoted headline fee may understate it.
Trading spreads, conversion costs and transaction charges also deserve attention. Some are paid when an action occurs rather than annually. Put them in the period in which they arise instead of turning every cost into an assumed annual percentage. A realistic model follows cash and valuation effects through time rather than forcing unlike charges into one label.
6. Entry and exit charges change the result
Take another hypothetical $100,000 commitment. A 2% entry charge leaves $98,000 invested. That balance earns an assumed 6% gross return, reaching $103,880. A 1% fee on the resulting balance leaves $102,841.20. A 2% exit charge then leaves $100,784.38 before tax. The investor's one-year gain on the original $100,000 is approximately 0.78%.
The example does not claim that this is a typical fee package. It shows why an appealing gross return cannot be evaluated independently of the route from committed money to money received back. A charge at entry reduces invested capital immediately. A charge at exit reduces the proceeds available for the next investment or another use.
For a multi-year holding, place each fee on its actual date. A fixed exit charge may have a different effect when the investment is held for one year or ten years. Early-exit penalties may also change over time. A single annualized cost can hide these details, so retain the original cash-flow schedule alongside any summary measure.
7. Ask what a higher-cost option must earn
If two investments provide the same exposure and the same gross return, a higher fee leaves less capital under an otherwise identical model. In practice, alternatives may differ in strategy, service, restrictions and risk. The analysis should acknowledge those differences rather than assume that a lower price proves that every feature is equivalent.
Suppose a hypothetical fee-free reference earns 6% for one year. Under the article's end-of-year charging convention, a 1% fee option would need a gross return of approximately 7.07% to deliver that same 6% net result. Solve one plus the gross return, multiplied by 0.99, equal to 1.06. The 7.07% figure is a hurdle in this example, not a prediction.
A higher cost might purchase advice, administration, access or a different investment process. Identify that service and evaluate it explicitly. Claims of superior performance require evidence and a relevant benchmark, with attention to risk and costs. A fee schedule is known in advance more clearly than future outperformance is, even when the service itself has genuine value.
8. Fixed charges matter differently for different balances
A $120 annual account charge equals 1.2% of a $10,000 balance but only 0.12% of a $100,000 balance, assuming those balances stay unchanged for the comparison. The same invoice can therefore have a very different effect on percentage return. Minimum annual charges can make a headline percentage an incomplete guide for a smaller account.
Tiered schedules need similar care. Some apply a rate to the whole balance once a threshold is reached. Others charge different rates on different slices of assets. Those structures can produce different totals at the same account value. Use the provider's actual formula rather than select the lowest rate printed in a table.
Repeated small transactions can also make a fixed dealing fee significant. Compare the charge with the size and purpose of the transaction, and include any minimum conversion cost. This is an investment execution question, not a reason to combine transactions mechanically when that would change risk or conflict with the intended strategy.
9. Costs continue to matter in negative years
In a separate one-year example, a $100,000 balance falls 10% before a 1% fee is charged on the remaining value. The gross investment loss leaves $90,000. The subsequent $900 charge leaves $89,100, which is a total decline of 10.9% from the opening balance. The fee has not disappeared because the market return was negative.
Real contracts may include different rules, minimums or performance-related charges. Read how any performance fee defines profit, its benchmark, the measurement period and whether a high-water-mark mechanism applies. Those features can change when a charge is triggered. A label alone does not establish whether earlier losses must be recovered before another performance fee is earned.
Do not assume that high costs imply protection against losses or that low costs remove market risk. The cost analysis and the investment-risk analysis answer different questions. Both belong in the decision. A clearly documented fee may still accompany an unsuitable exposure, and a useful service may still need a realistic cost comparison.
10. Make a fee comparison reproducible
For a practical comparison, use a dated worksheet with the same starting capital, gross-return assumptions and cash-flow dates for every option. Add entry charges, recurring charges, transaction costs and exit charges separately. Show the value before investor-level tax, then add any relevant tax scenario as a distinct layer rather than quietly blending assumptions.
Run more than one return path and holding period. A constant annual return makes the fee mechanism easy to see, but actual markets move unevenly. Contributions and withdrawals can also change the balances on which charges are based. State which costs are verified, which are quoted and which remain estimates, so another reader can reproduce the calculation.
The result should answer a concrete set of questions: What money is actually invested? What is charged, when and on what base? Which costs are already reflected in performance? What services or exposures differ between the alternatives? What cash would remain at exit? Clear answers make fees part of investment selection instead of an afterthought.
Frequently asked questions
Does a 1% annual fee mean exactly one percentage point less return?
Not under every charging convention. In this article's example, 6% gross growth followed by a 1% fee on the grown balance leaves a 4.94% net return.
Is the $58,400 gap the amount of fees directly paid?
No. It is the modeled ending-value difference between matched no-fee and 1% paths over twenty years, including growth forgone on amounts deducted.
Should every investor choose the lowest quoted fee?
Costs should be compared alongside exposure, risk, service and restrictions. The lowest headline price is not a complete description of an investment.
Are the examples market forecasts?
No. They are original hypothetical calculations with stated charging rules, no tax and no unstated contributions or withdrawals.
Educational investment commentary. All numerical examples are hypothetical, with assumptions stated in the text and graphics. They are not market forecasts or individual investment recommendations.
Continue reading
Investment Drawdowns and Recovery: Why a 20% Loss Needs a 25% Gain — Firat Zan
Portfolio Concentration Risk — Firat Zan